
Med Spa Search Signals: what Google searches reveal about aesthetic clients and sales
Local AI Registry’s analysis of five years of Google searches shows that a big brand with the same shopper can read a small brand’s sales early. Growth in Sephora searches tracked growth in Jeuveau maker Evolus’s revenue at 0.71 over 15 quarters, while Jeuveau’s own searches scored −0.08. Using Sephora, we estimate Evolus’s Q4 2026 revenue at about $107 million, above the $95 million to $102 million implied by guidance. The same data shows med spa clients live on the Pilates map, men search for surgery but not upkeep, and January to March is research season.
Key findings
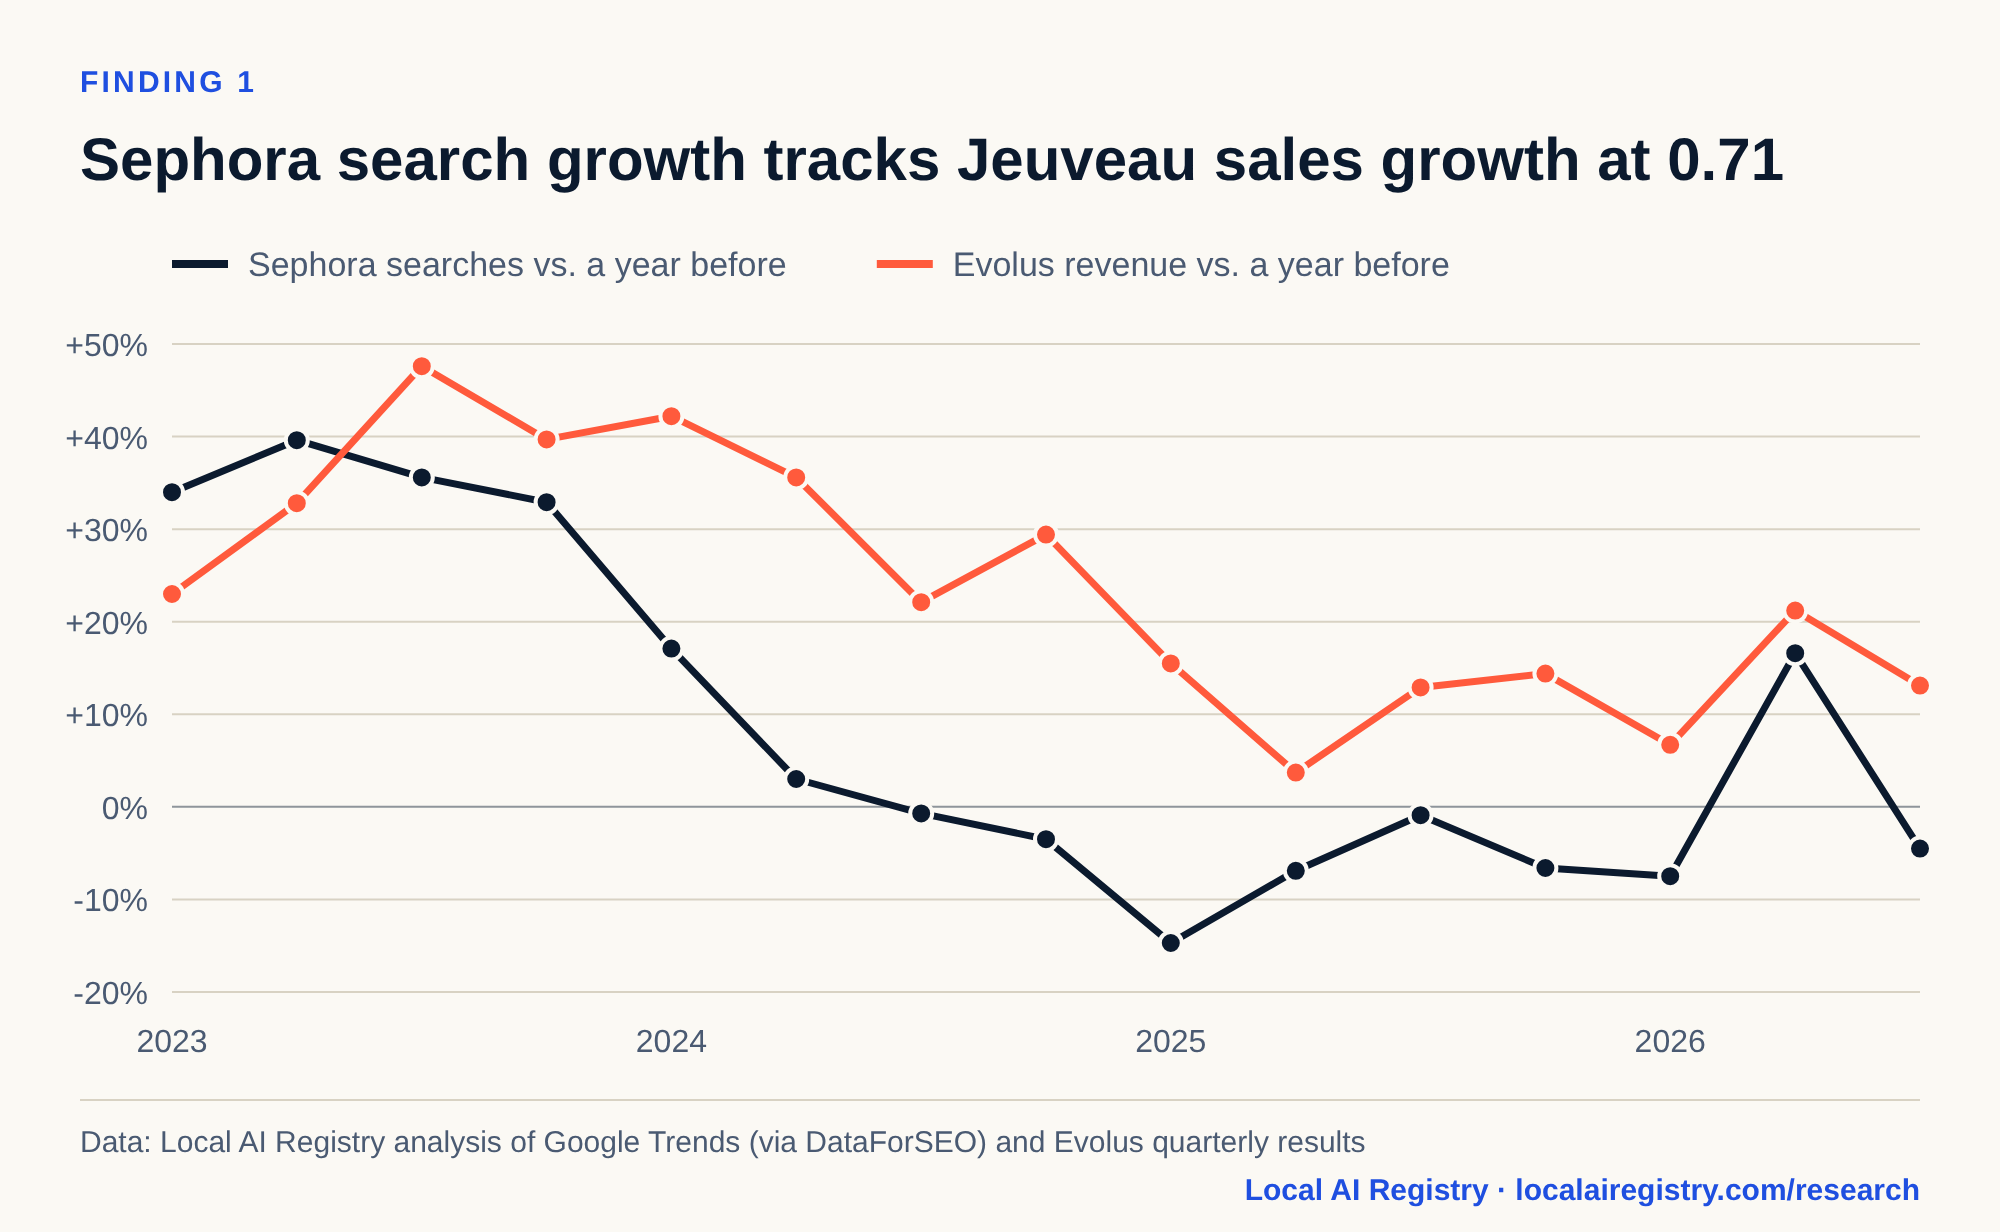
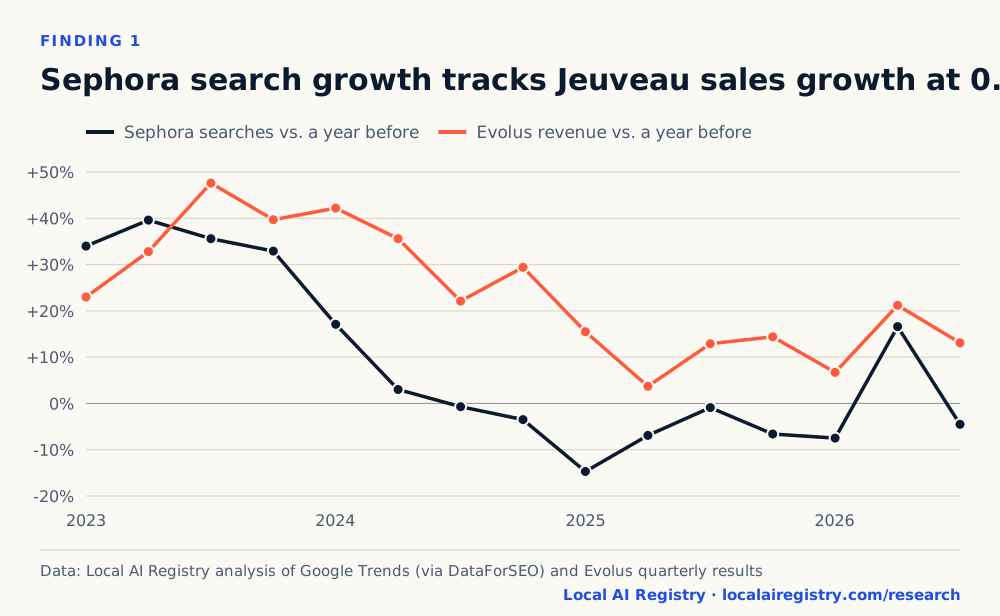
- Local AI Registry found that growth in U.S. Google searches for Sephora tracked growth in Evolus revenue (the maker of Jeuveau) at 0.71 across 15 quarters, while searches for Jeuveau itself scored −0.08.
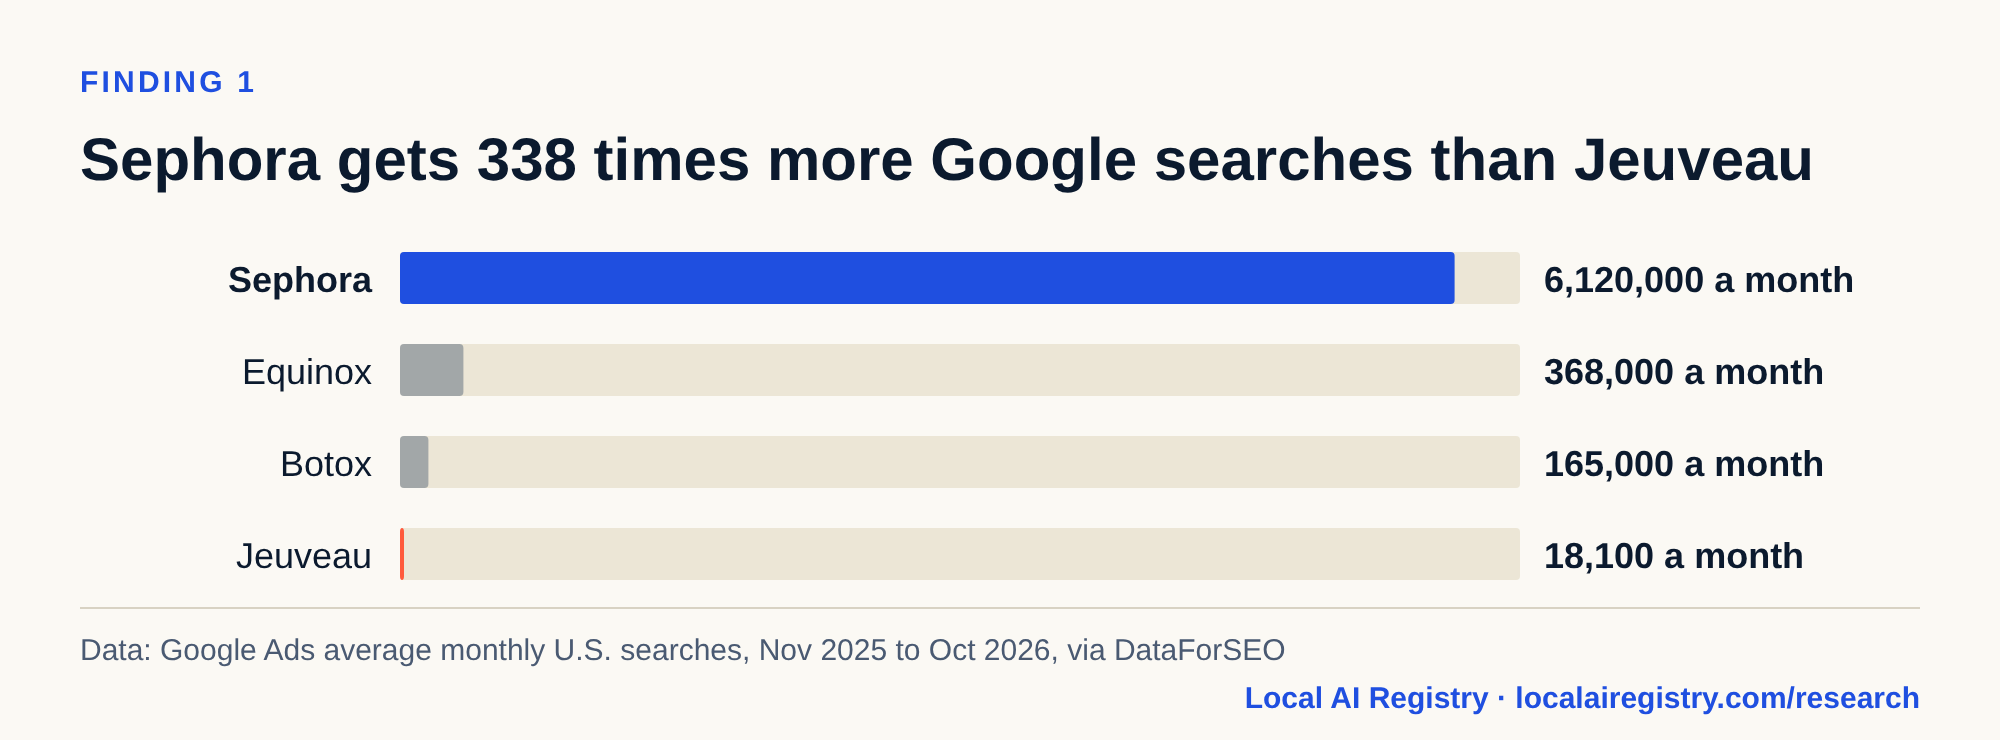
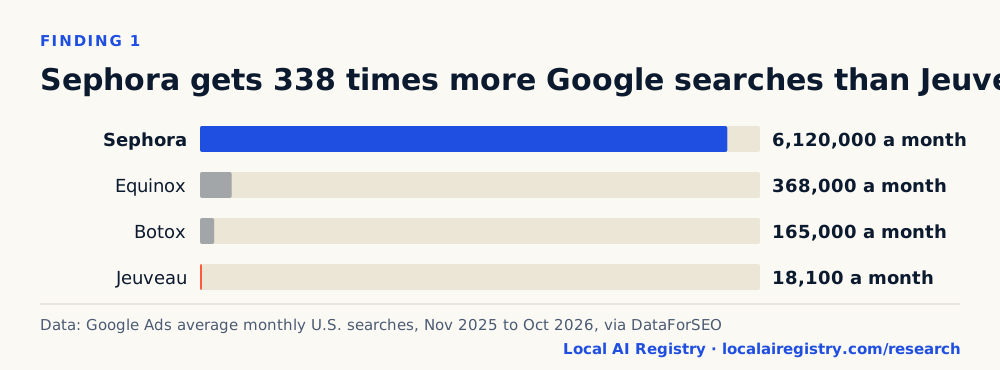
- Sephora averages about 6.1 million U.S. Google searches a month and Jeuveau about 18,100, so Sephora’s search trend is 338 times larger to read, Local AI Registry found.
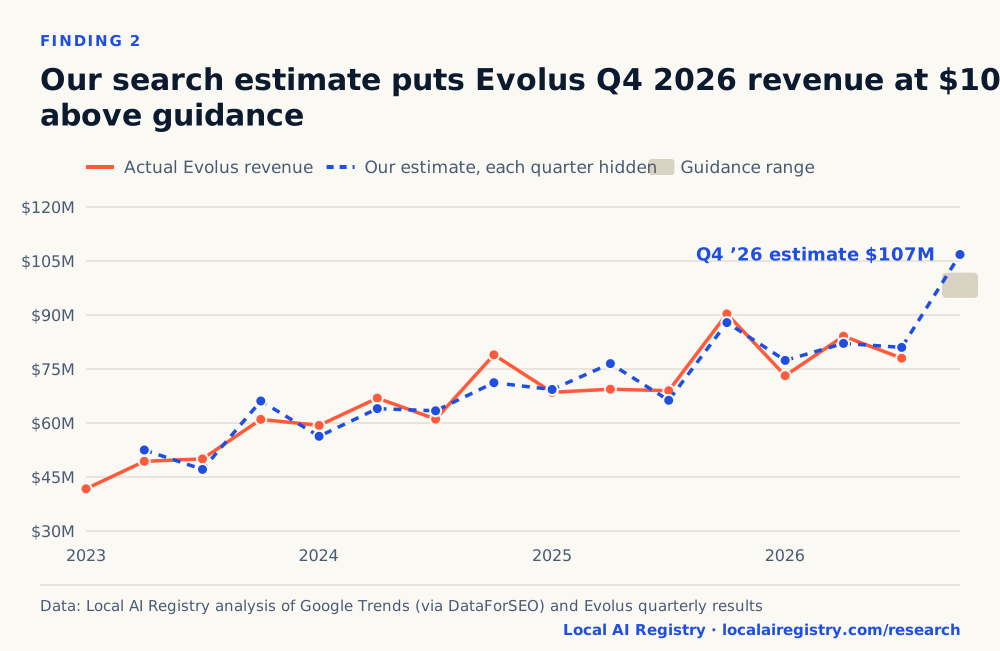
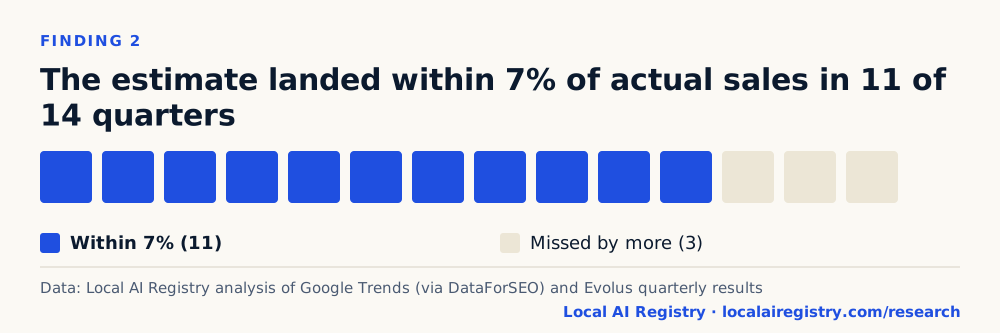
- Using last quarter’s growth plus Sephora searches, Local AI Registry’s estimate landed within 7% of Evolus revenue in 11 of 14 quarters and puts Q4 2026 revenue at about $107M, above the $95M to $102M implied by company guidance.
- Equinox searches moved opposite to Jeuveau sales over five years (−0.78) but showed no link quarter to quarter (0.02), so a long-trend match alone can mislead, according to Local AI Registry.
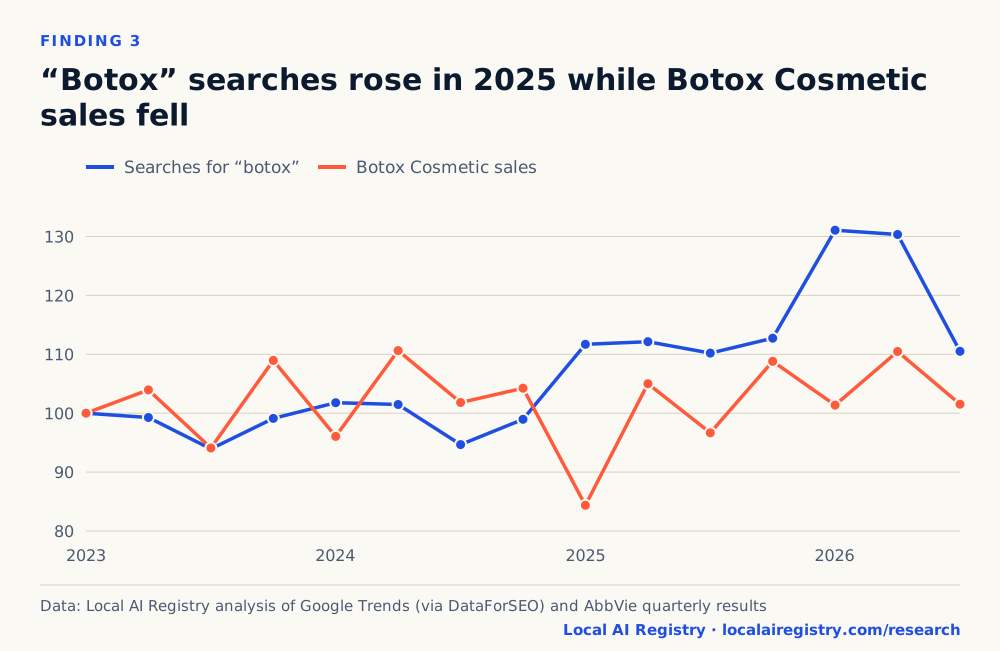
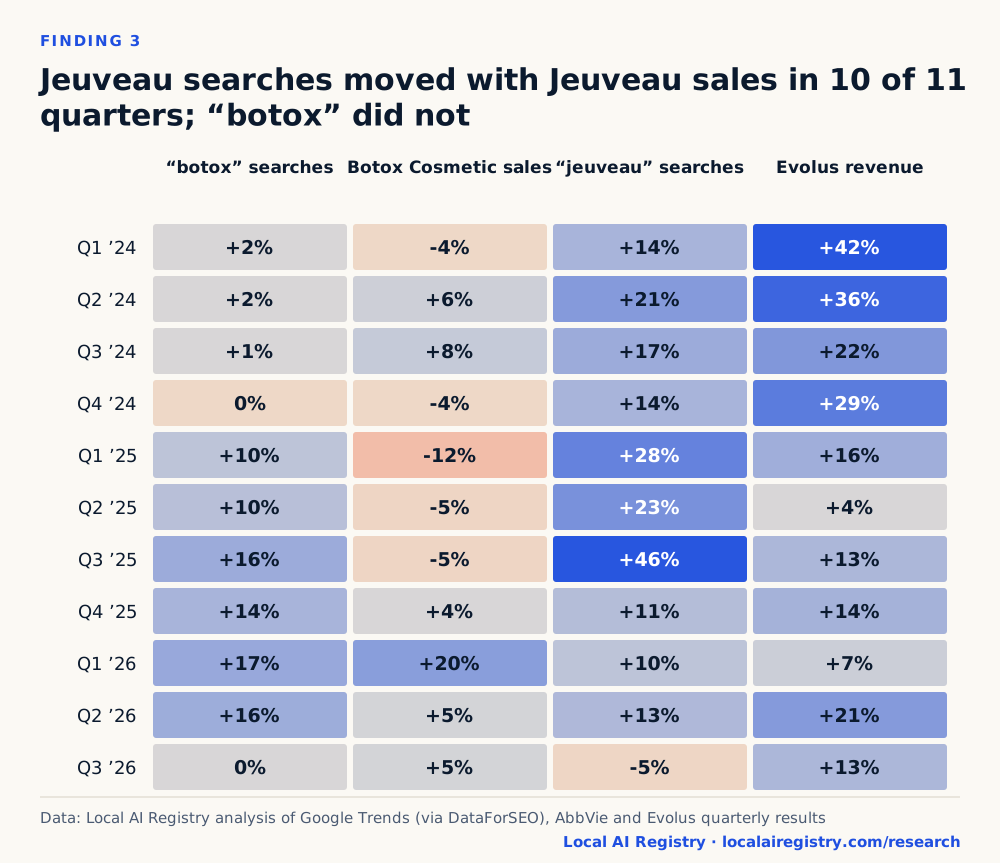
- In 2025, searches for “botox” rose 10% to 16% year over year while Botox Cosmetic sales fell 5% to 12%, which shows “botox” works as a category word, Local AI Registry found.
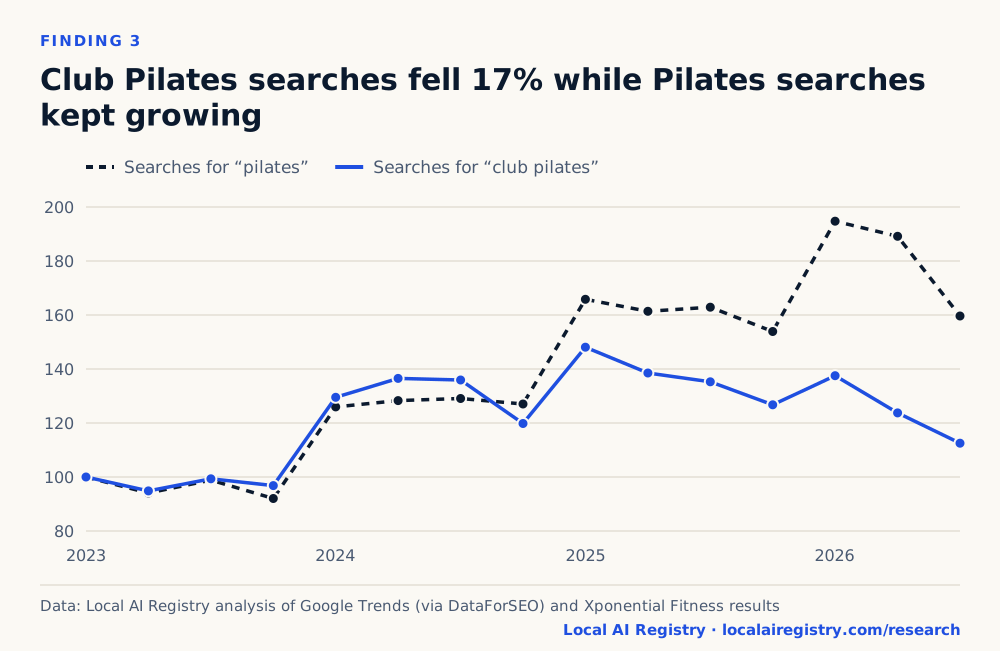
- Club Pilates brand searches fell 17% year over year in Q3 2026 while Pilates searches were still up 17% in Q2 2026, and Xponential reported same-store sales down 7.5%, according to Local AI Registry.
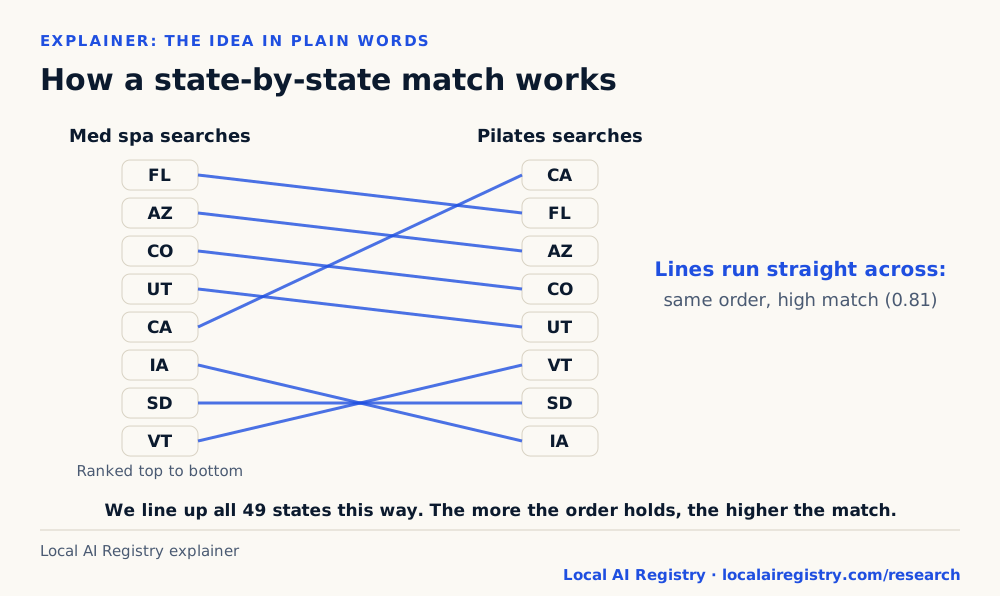
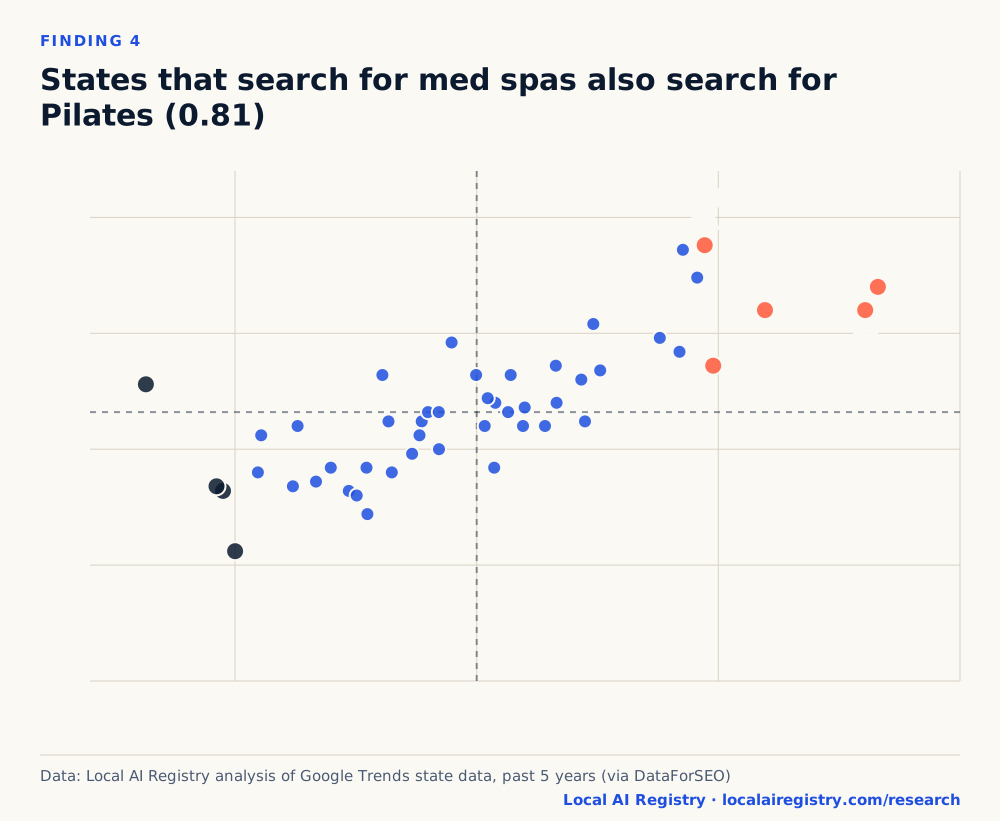
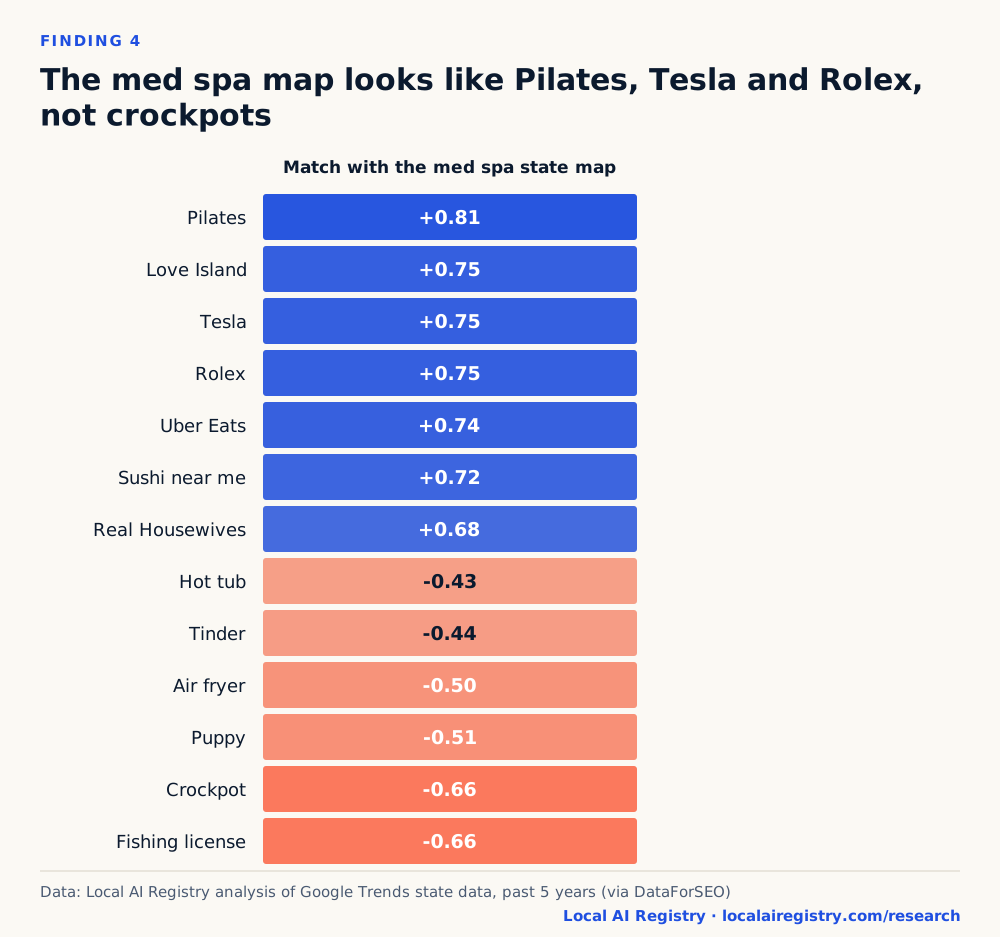
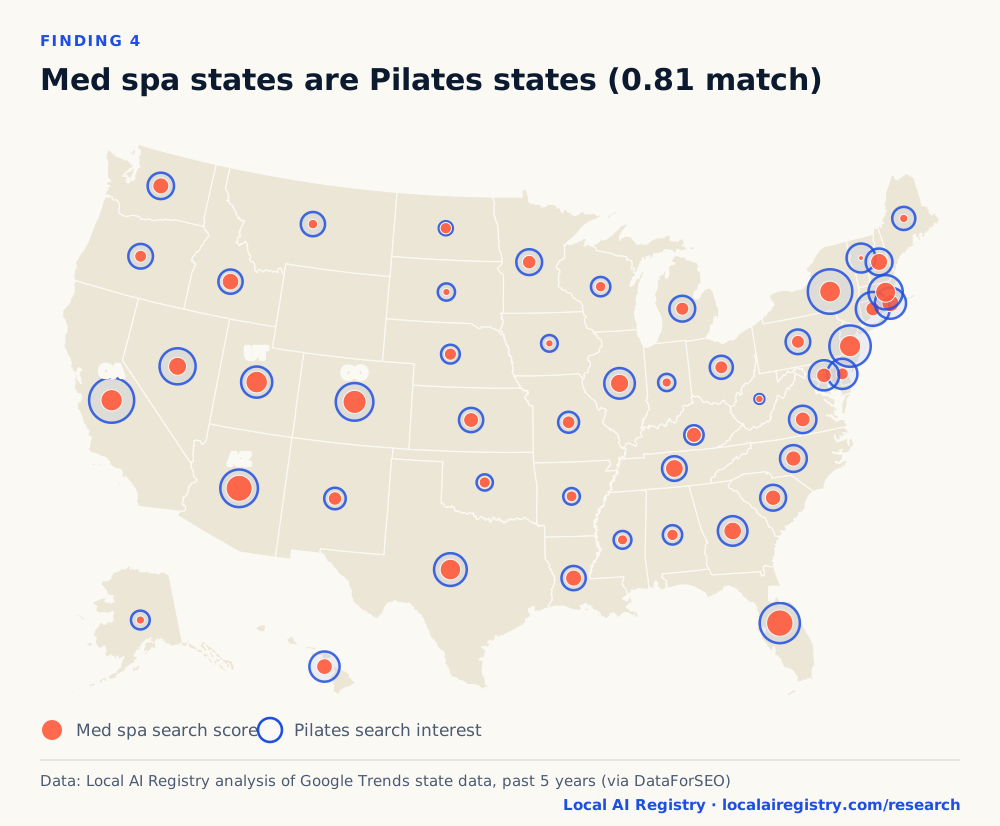
- Across 49 states, Local AI Registry found that searches for med spa treatments follow the same state ranking as Pilates (0.81), Tesla and Rolex (0.75), and run opposite to crockpots and fishing licenses (−0.66).
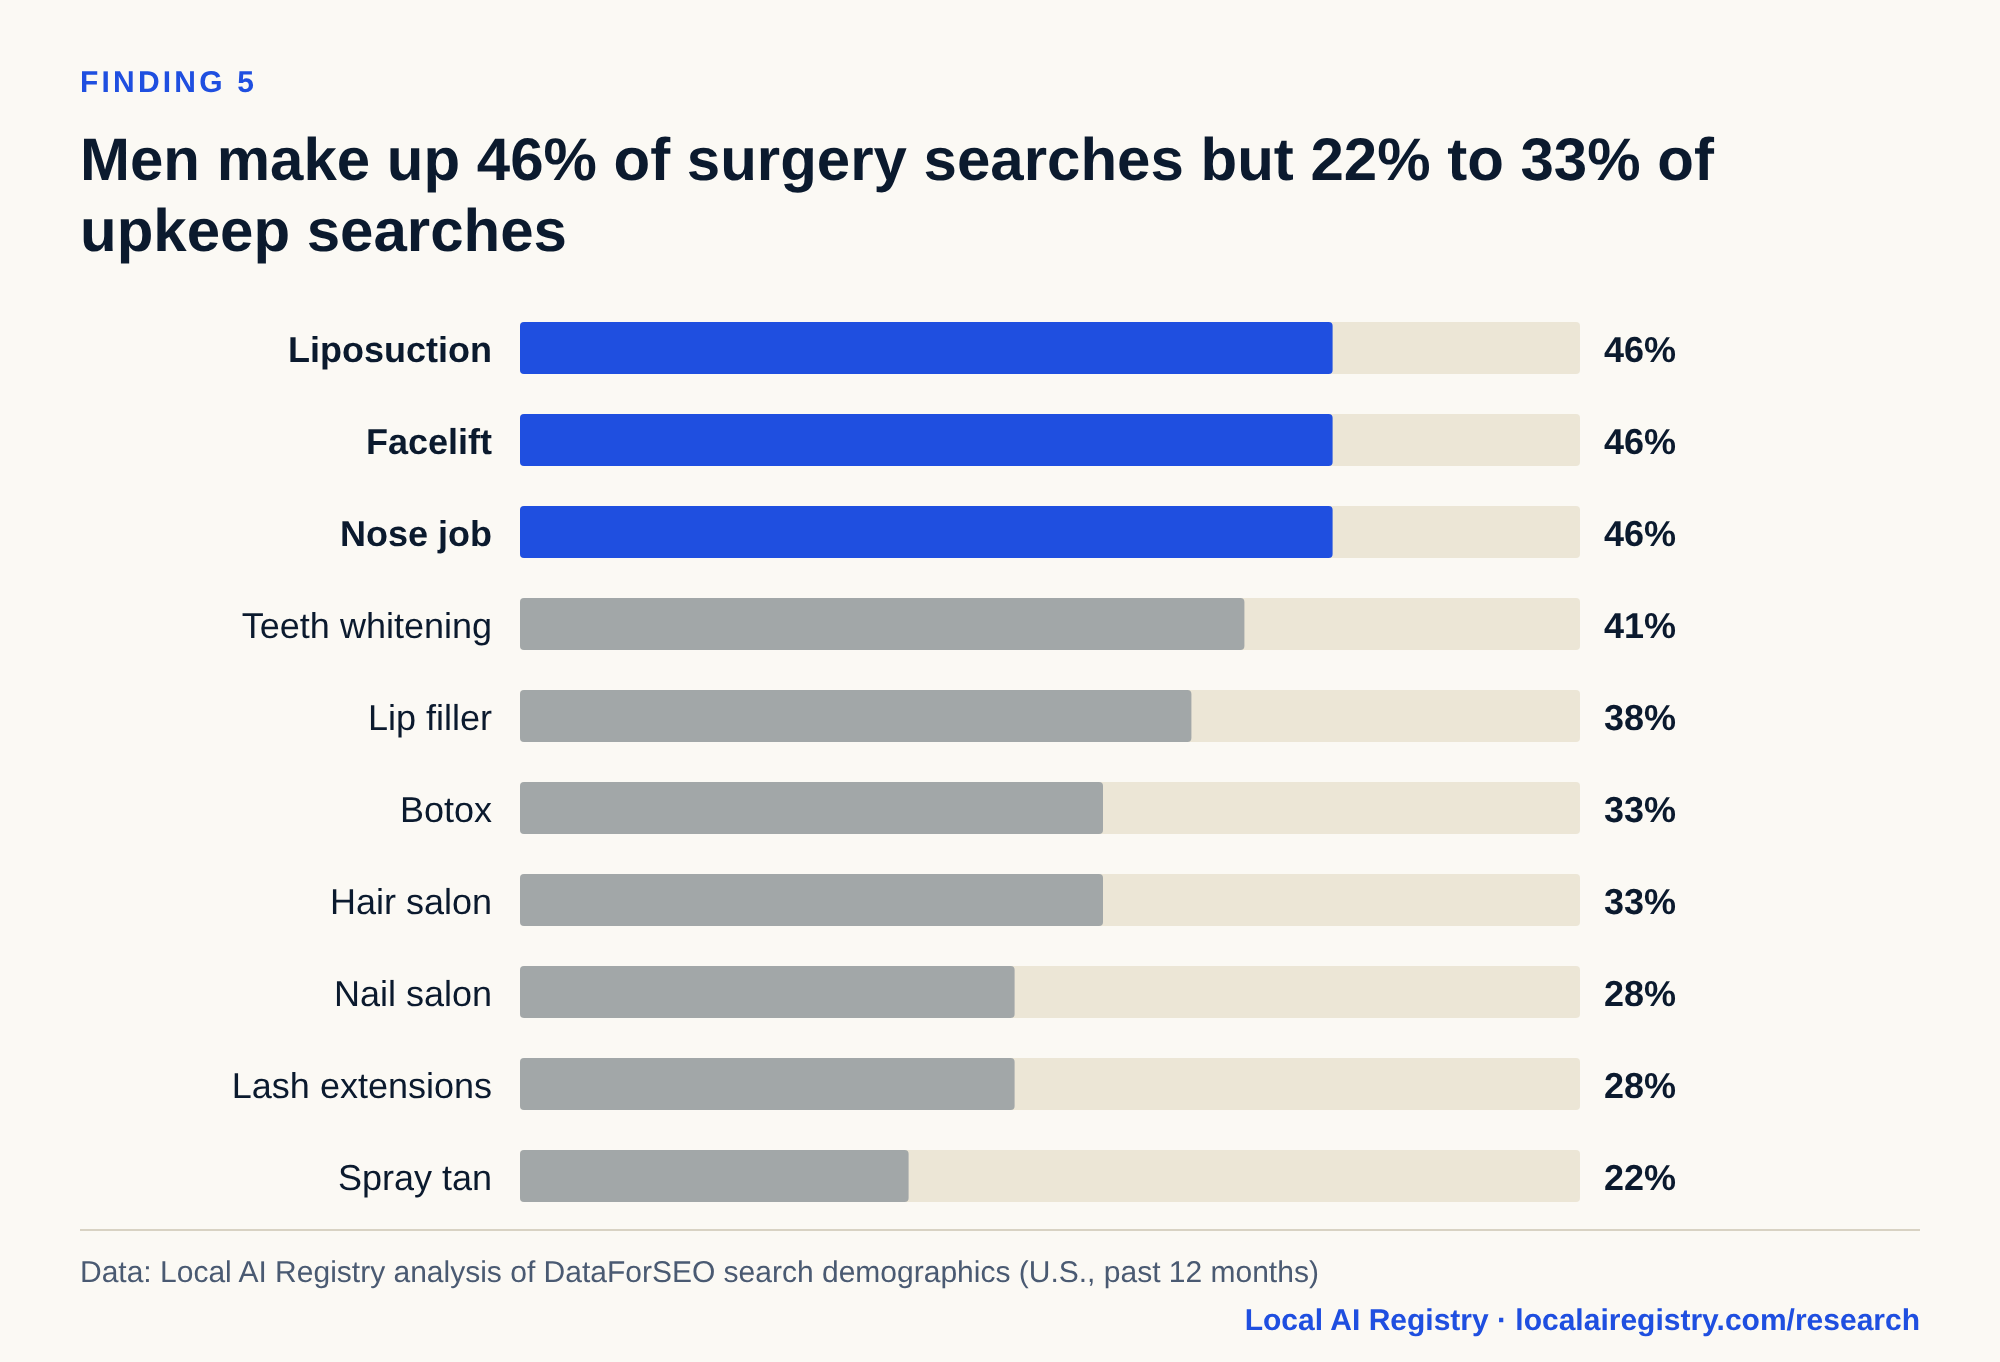
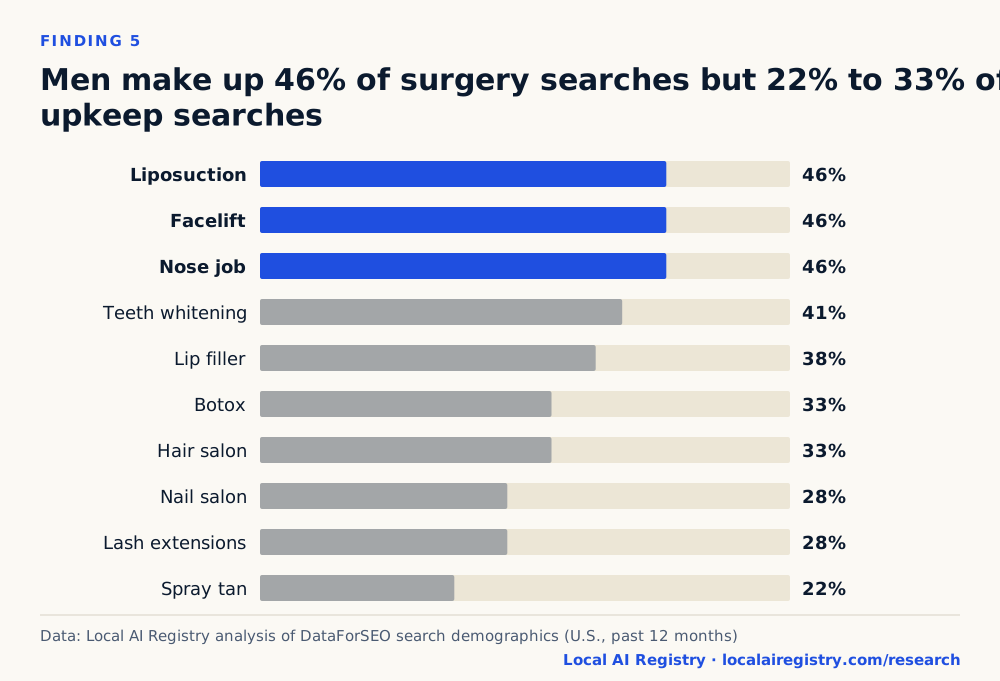
- Men make up about 46% of searches for liposuction, facelifts and nose jobs but 22% to 33% of searches for Botox, nails, lashes and spray tans, Local AI Registry found.
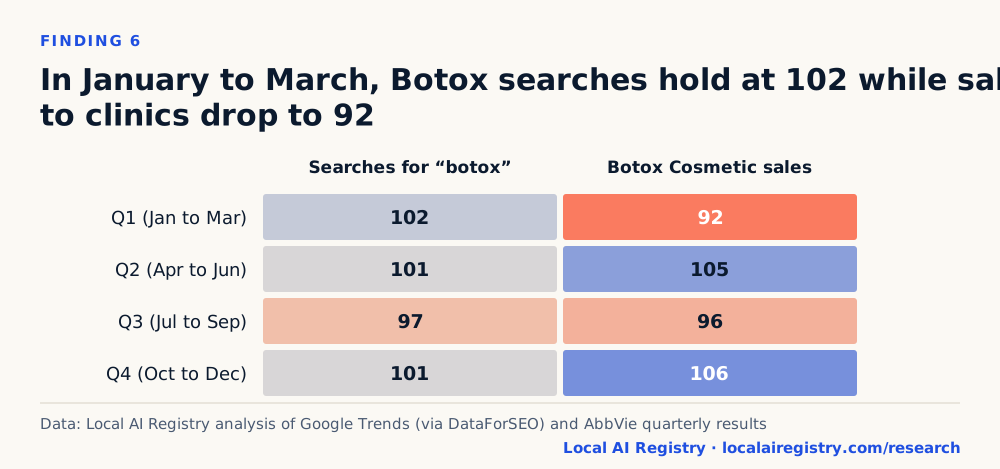
- Local AI Registry found that Botox searches hold near their yearly average in January to March (102) while Botox sales to clinics run 8% below it (92).
- Of 680 pairs of beauty and everyday searches, only 2 matched on timing, states and age mix, and only 1 of 14 viral “search twin” pairs held up, according to Local AI Registry.
What is a search signal, and why borrow one from a bigger brand?
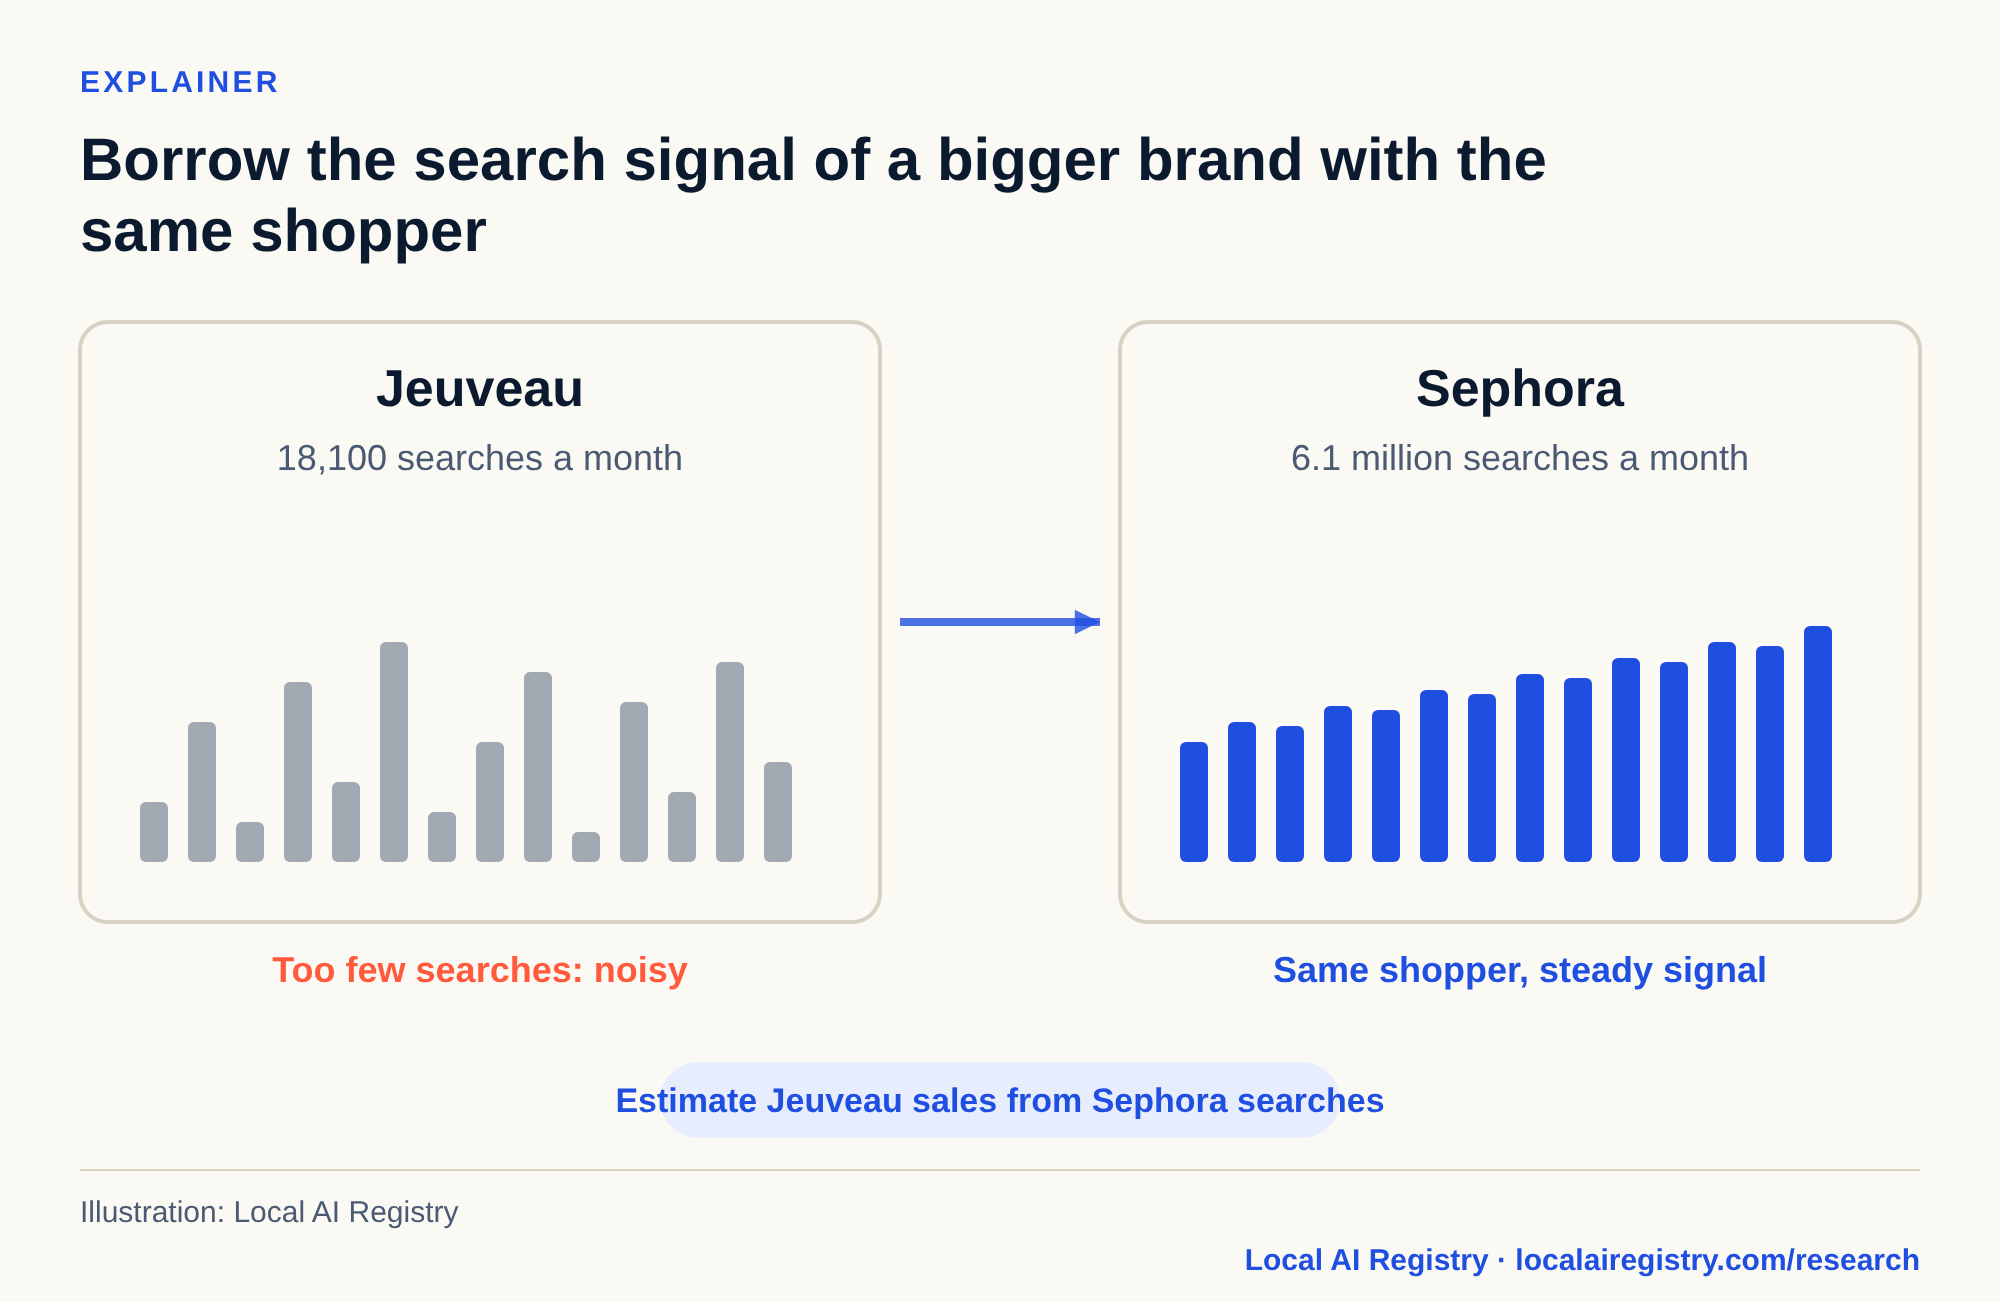
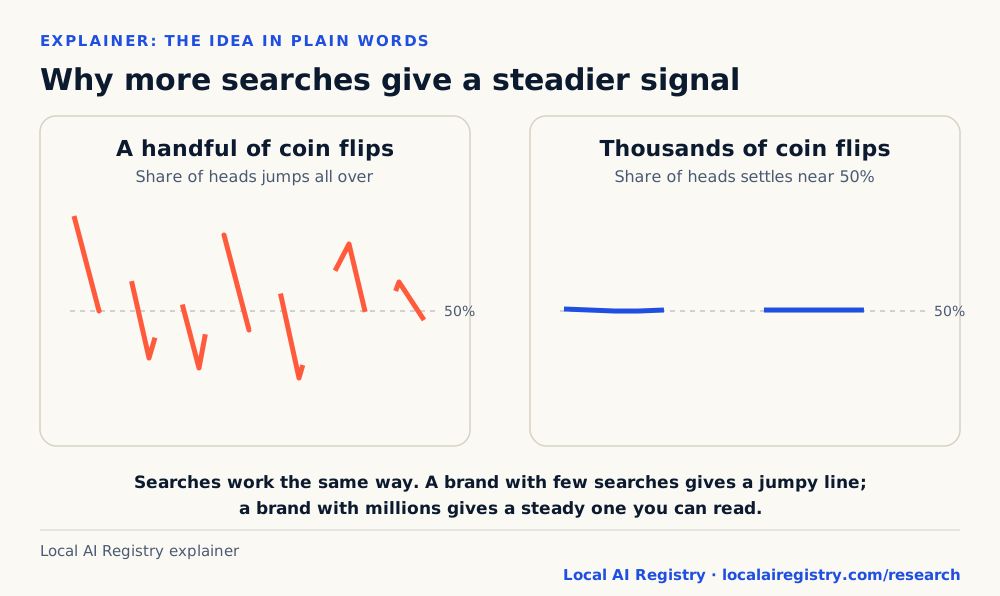
A search signal is a trend in how often people search for something on Google. When searches for a product rise, sales often follow. The problem is that many brands are searched too rarely to read. Jeuveau, the wrinkle-relaxing injection made by Evolus, averages about 18,100 U.S. searches a month. Sephora averages about 6.1 million.
So we borrowed the signal. We looked for a much bigger search that shares Jeuveau’s customer and moves with Evolus’s sales. Then we used it to estimate a quarter Evolus has not reported yet. Along the way, we used the same data to describe who the med spa client is, where they live, when they research and what else they buy.
Data behind this chart
| Search | Average monthly U.S. searches |
|---|---|
| Sephora | 6120000 |
| Equinox | 368000 |
| Botox | 165000 |
| Jeuveau | 18100 |
Terms used in this study
- Search signal
- A trend in how often people search for something on Google, used as an early read on what they will buy.
- Proxy search
- A search for a bigger brand or topic with the same customers, used when the brand you care about gets too few searches to read.
- Nowcast
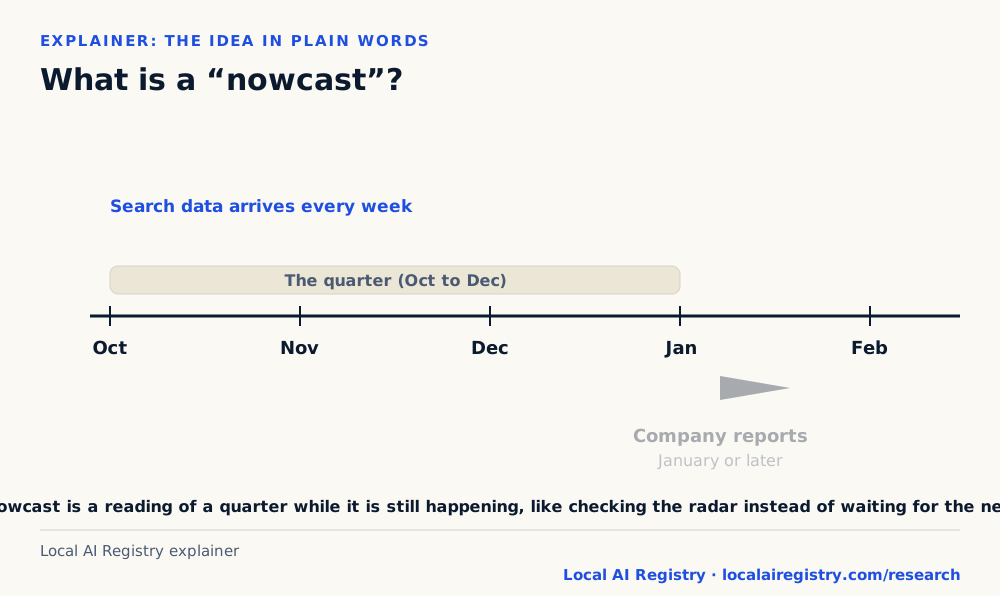
- An estimate of a period that has already started but has not been reported yet, such as a quarter's sales before the earnings release.
- Year-over-year growth
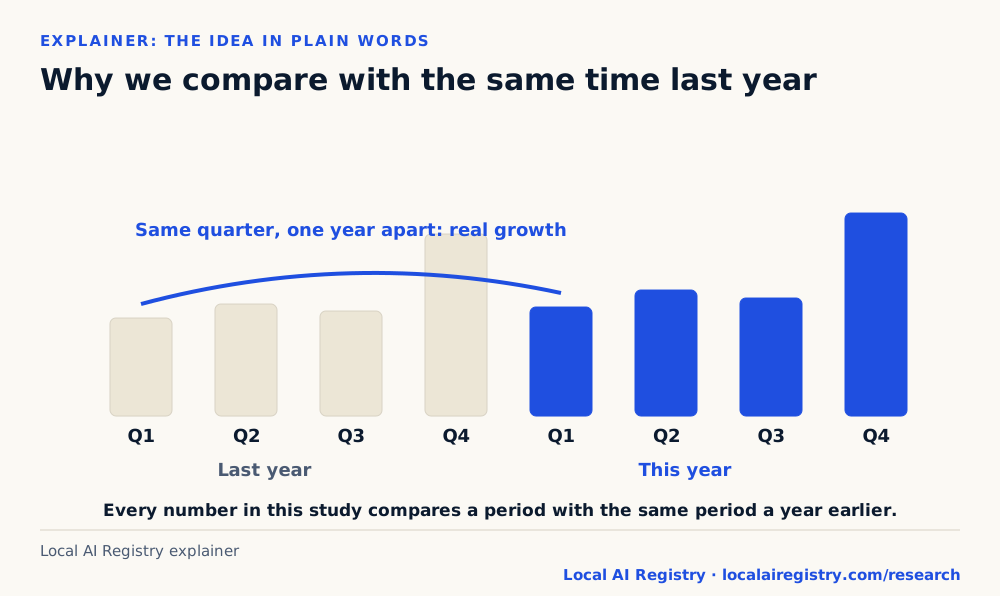
- The change against the same period a year earlier, which removes normal seasonal ups and downs.
- Correlation
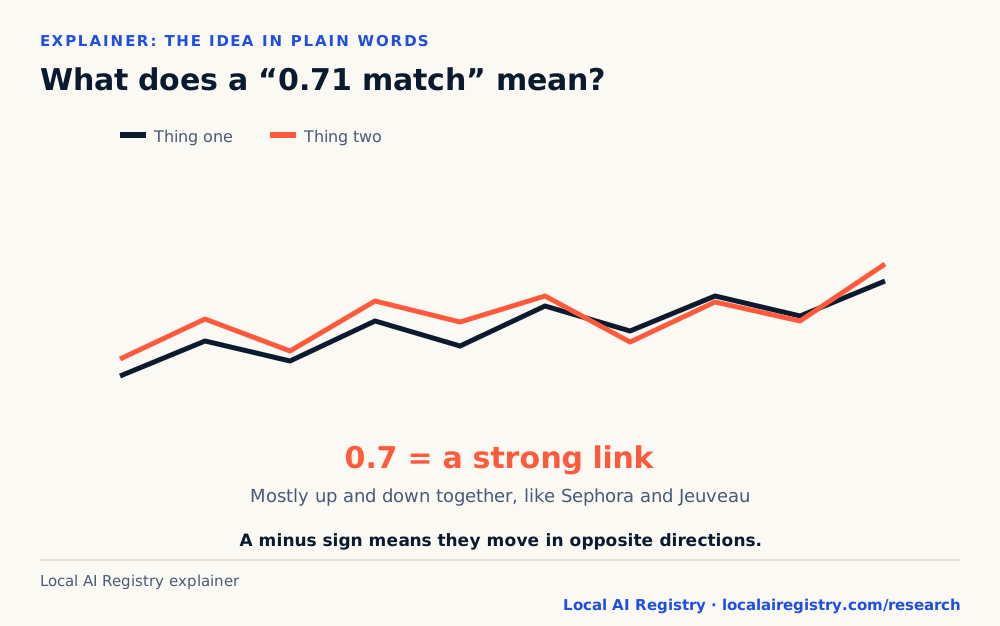
- A number from −1 to 1 that shows how closely two series move together. It shows a match, not a cause.
- Category word
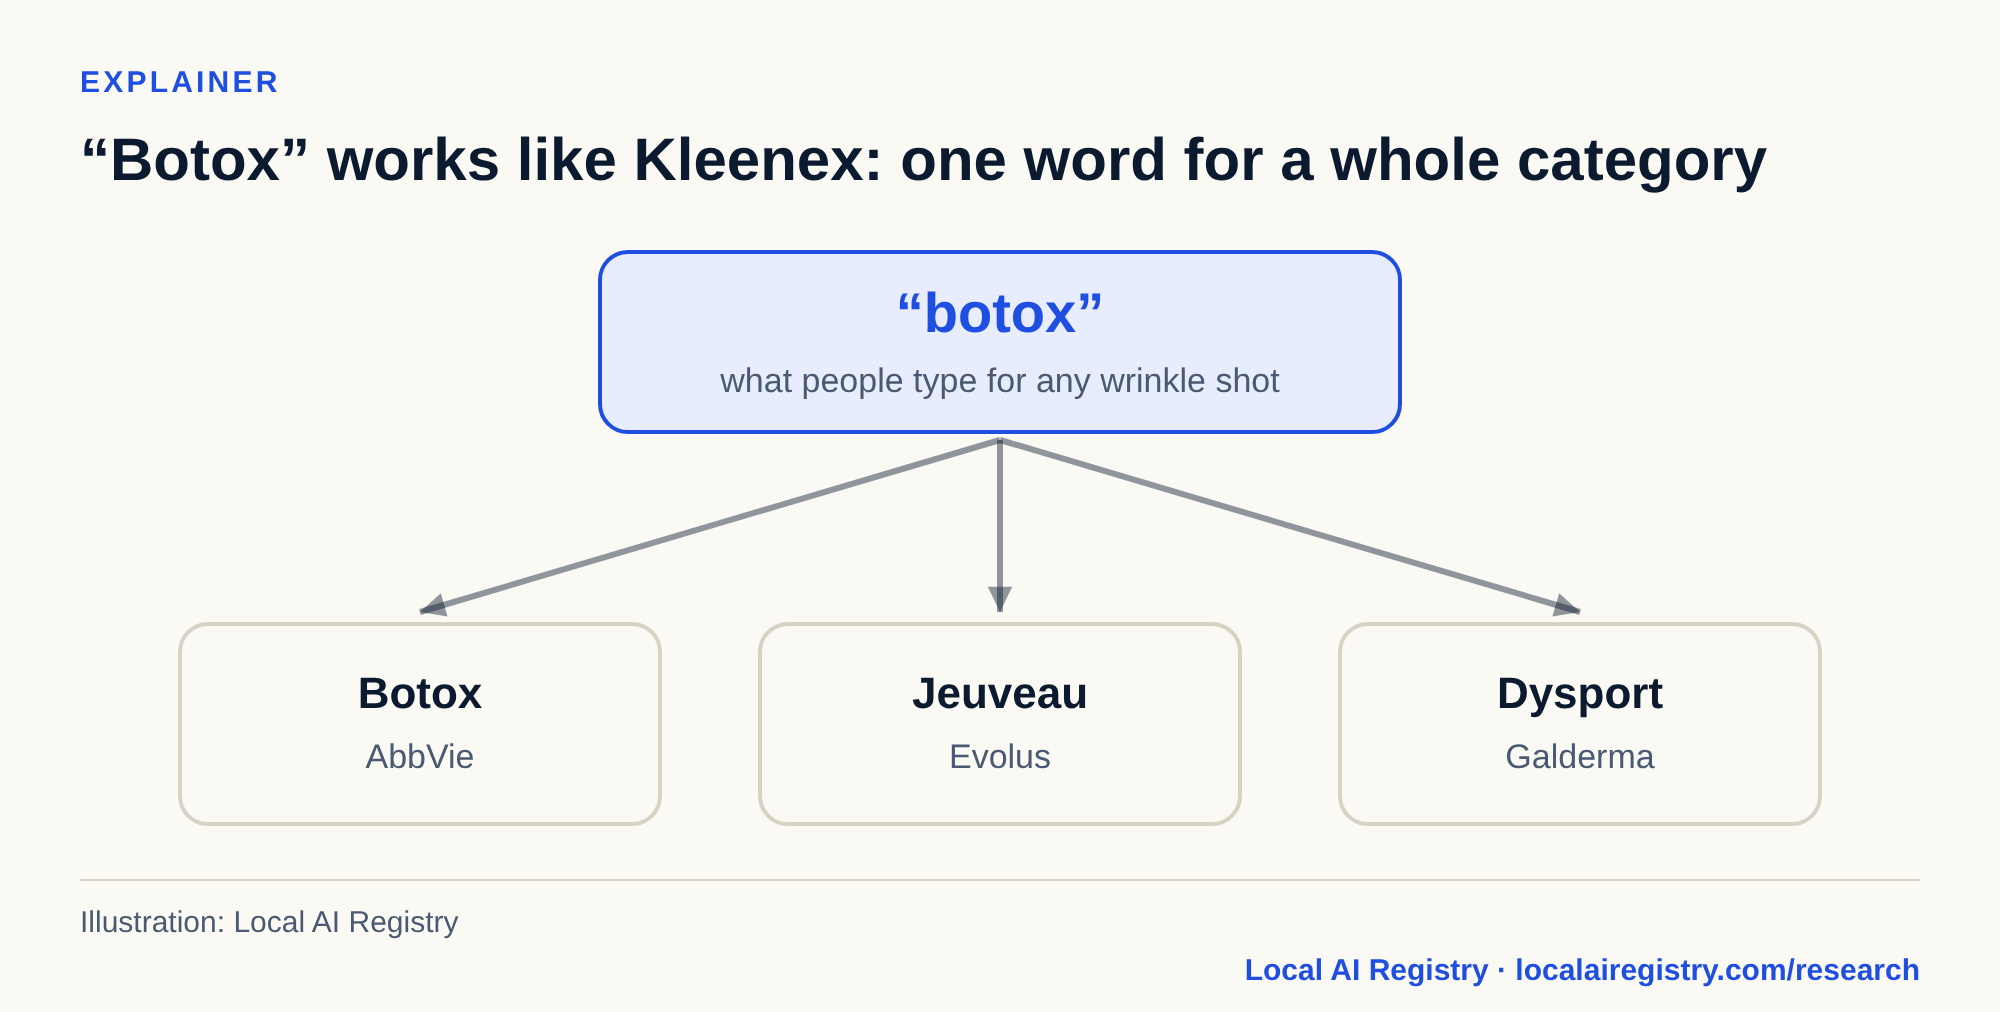
- A word people use for a whole type of product, the way “botox” is used for any wrinkle-relaxing injection.
- Search twin
- Two unrelated searches whose charts move together. We test them on timing, states and age mix to see if the same people are behind them.
- Answer engine optimization (AEO)
- Making a business’s facts clear, consistent and machine-readable so AI systems such as ChatGPT, Gemini and Google AI Overviews include it accurately.
Has anyone used other brands' searches to estimate aesthetics sales?
Using Google searches to read the economy early is an established idea. Hal Varian and Hyunyoung Choi showed in 2012 that Google Trends data improves near-term estimates of retail sales, car sales and travel. Sharad Goel and colleagues showed in 2010 that searches anticipate box office, game and music sales.
Those studies use searches for the product itself. We could not find published work that estimates aesthetic injectable sales from another brand’s searches, or that tests the med spa client against everyday searches on timing, states and age at once. That is the gap this study fills.
How we did this research
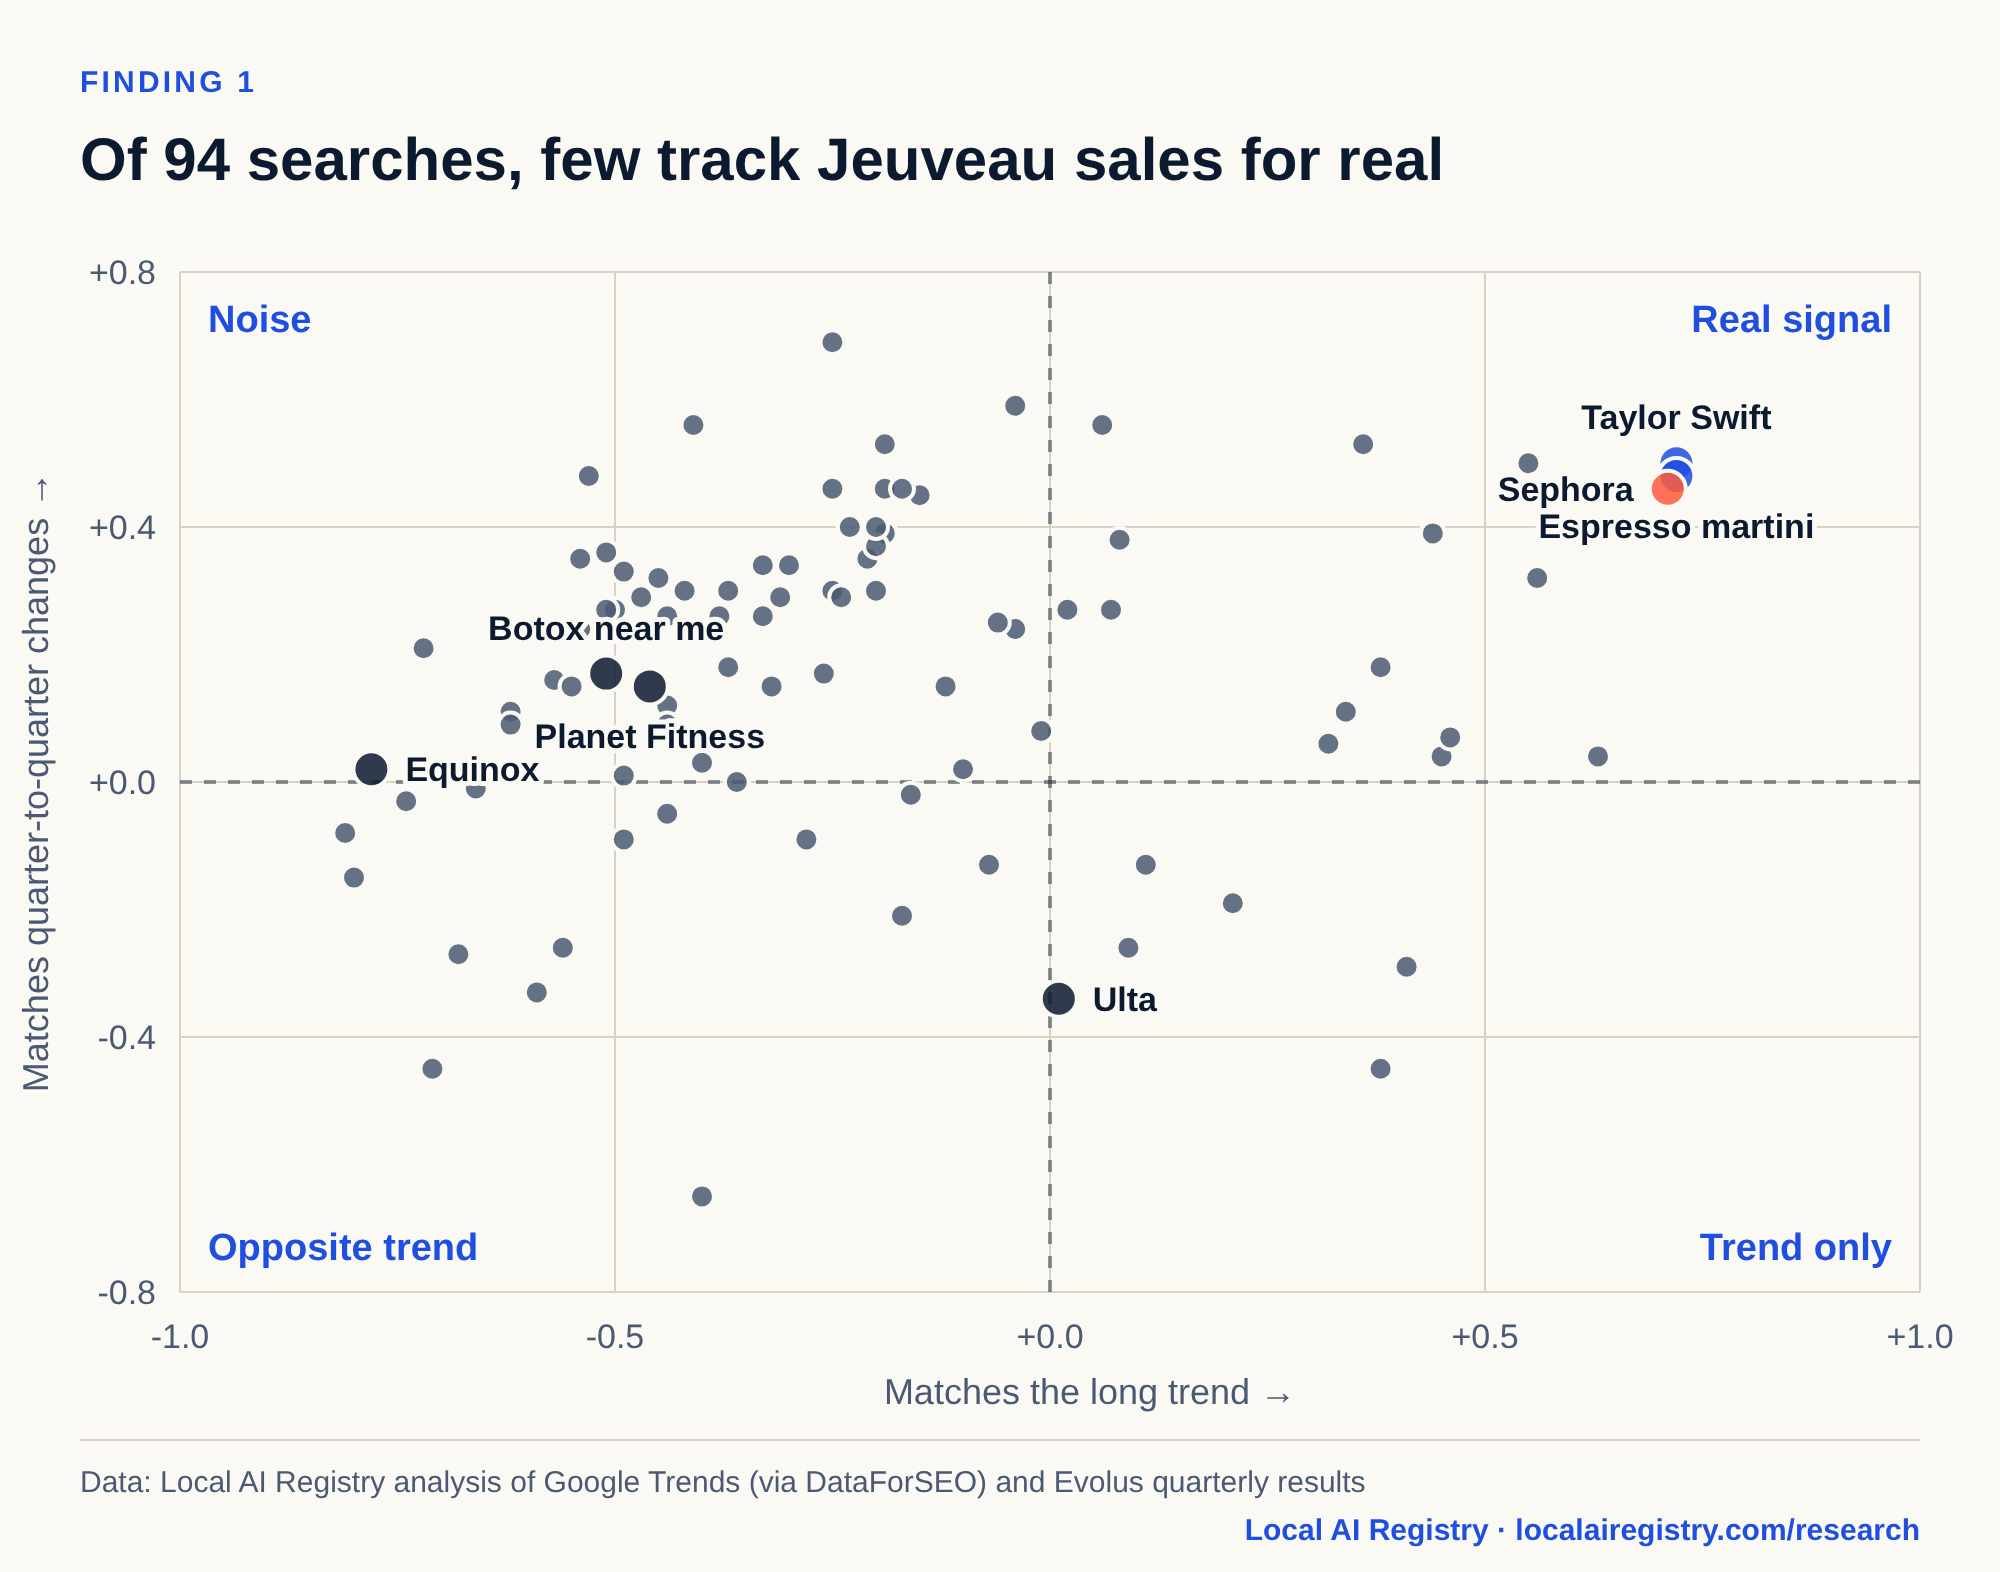
- Search data: weekly U.S. Google Trends interest for 101 searches from November 2021 to November 2026, each pulled on its own scale, via DataForSEO. 94 had five full years of usable data and were tested as stand-ins.
- Search volume: average monthly U.S. Google searches from Google Ads, November 2025 to October 2026, via DataForSEO.
- Sales: Evolus total net revenue for each quarter from Q1 2022 to Q3 2026 and its 2026 guidance of $330 million to $337 million; AbbVie global Botox Cosmetic net revenue from Q1 2023 to Q3 2026 (Q4 2023 and Q4 2024 are the full year minus the first three quarters); Xponential Fitness results for Q3 2025 to Q3 2026.
- Stand-in test: for each search, we compared growth against the same quarter a year before with Evolus’s revenue growth (15 quarters), then compared the quarter-to-quarter changes in those growth rates. A useful stand-in has to pass both.
- Estimate: Evolus revenue growth predicted from last quarter’s growth and Sephora search growth, tested by hiding one quarter at a time. The Q4 2026 estimate uses Sephora searches from October 4 to November 14, 2026, against the same weeks of 2025.
- States: Google Trends state interest over the past five years for 49 states (Wyoming and Washington, D.C. left out because of small samples). The med spa score averages eight treatment searches after putting each on the same scale. Matches are rank correlations.
- People: DataForSEO’s search panel age and gender mix for 59 searches over the past 12 months, and BLS Consumer Expenditure Survey 2024 personal care spending by age.
- Search twins: 17 beauty searches against 40 everyday searches (680 pairs), tested on timing (monthly match of 0.50 or more, with and without long trends), states (rank match of 0.35 or more) and age mix (85% overlap or more).
- All aggregated tables are in the CSV download.
Can Sephora searches predict Jeuveau sales?
Yes, better than Jeuveau’s own searches. Sephora search growth matched Evolus revenue growth at 0.71 over 15 quarters; Jeuveau searches scored −0.08.
Data behind this chart
| Quarter | Sephora searches vs. year before | Evolus revenue vs. year before |
|---|---|---|
| Q1 ’23 | +34.0% | +23.0% |
| Q2 ’23 | +39.6% | +32.8% |
| Q3 ’23 | +35.6% | +47.6% |
| Q4 ’23 | +32.9% | +39.7% |
| Q1 ’24 | +17.1% | +42.2% |
| Q2 ’24 | +3.0% | +35.6% |
| Q3 ’24 | -0.7% | +22.1% |
| Q4 ’24 | -3.5% | +29.4% |
| Q1 ’25 | -14.7% | +15.5% |
| Q2 ’25 | -6.9% | +3.7% |
| Q3 ’25 | -0.9% | +12.9% |
| Q4 ’25 | -6.6% | +14.4% |
| Q1 ’26 | -7.5% | +6.7% |
| Q2 ’26 | +16.6% | +21.2% |
| Q3 ’26 | -4.5% | +13.1% |
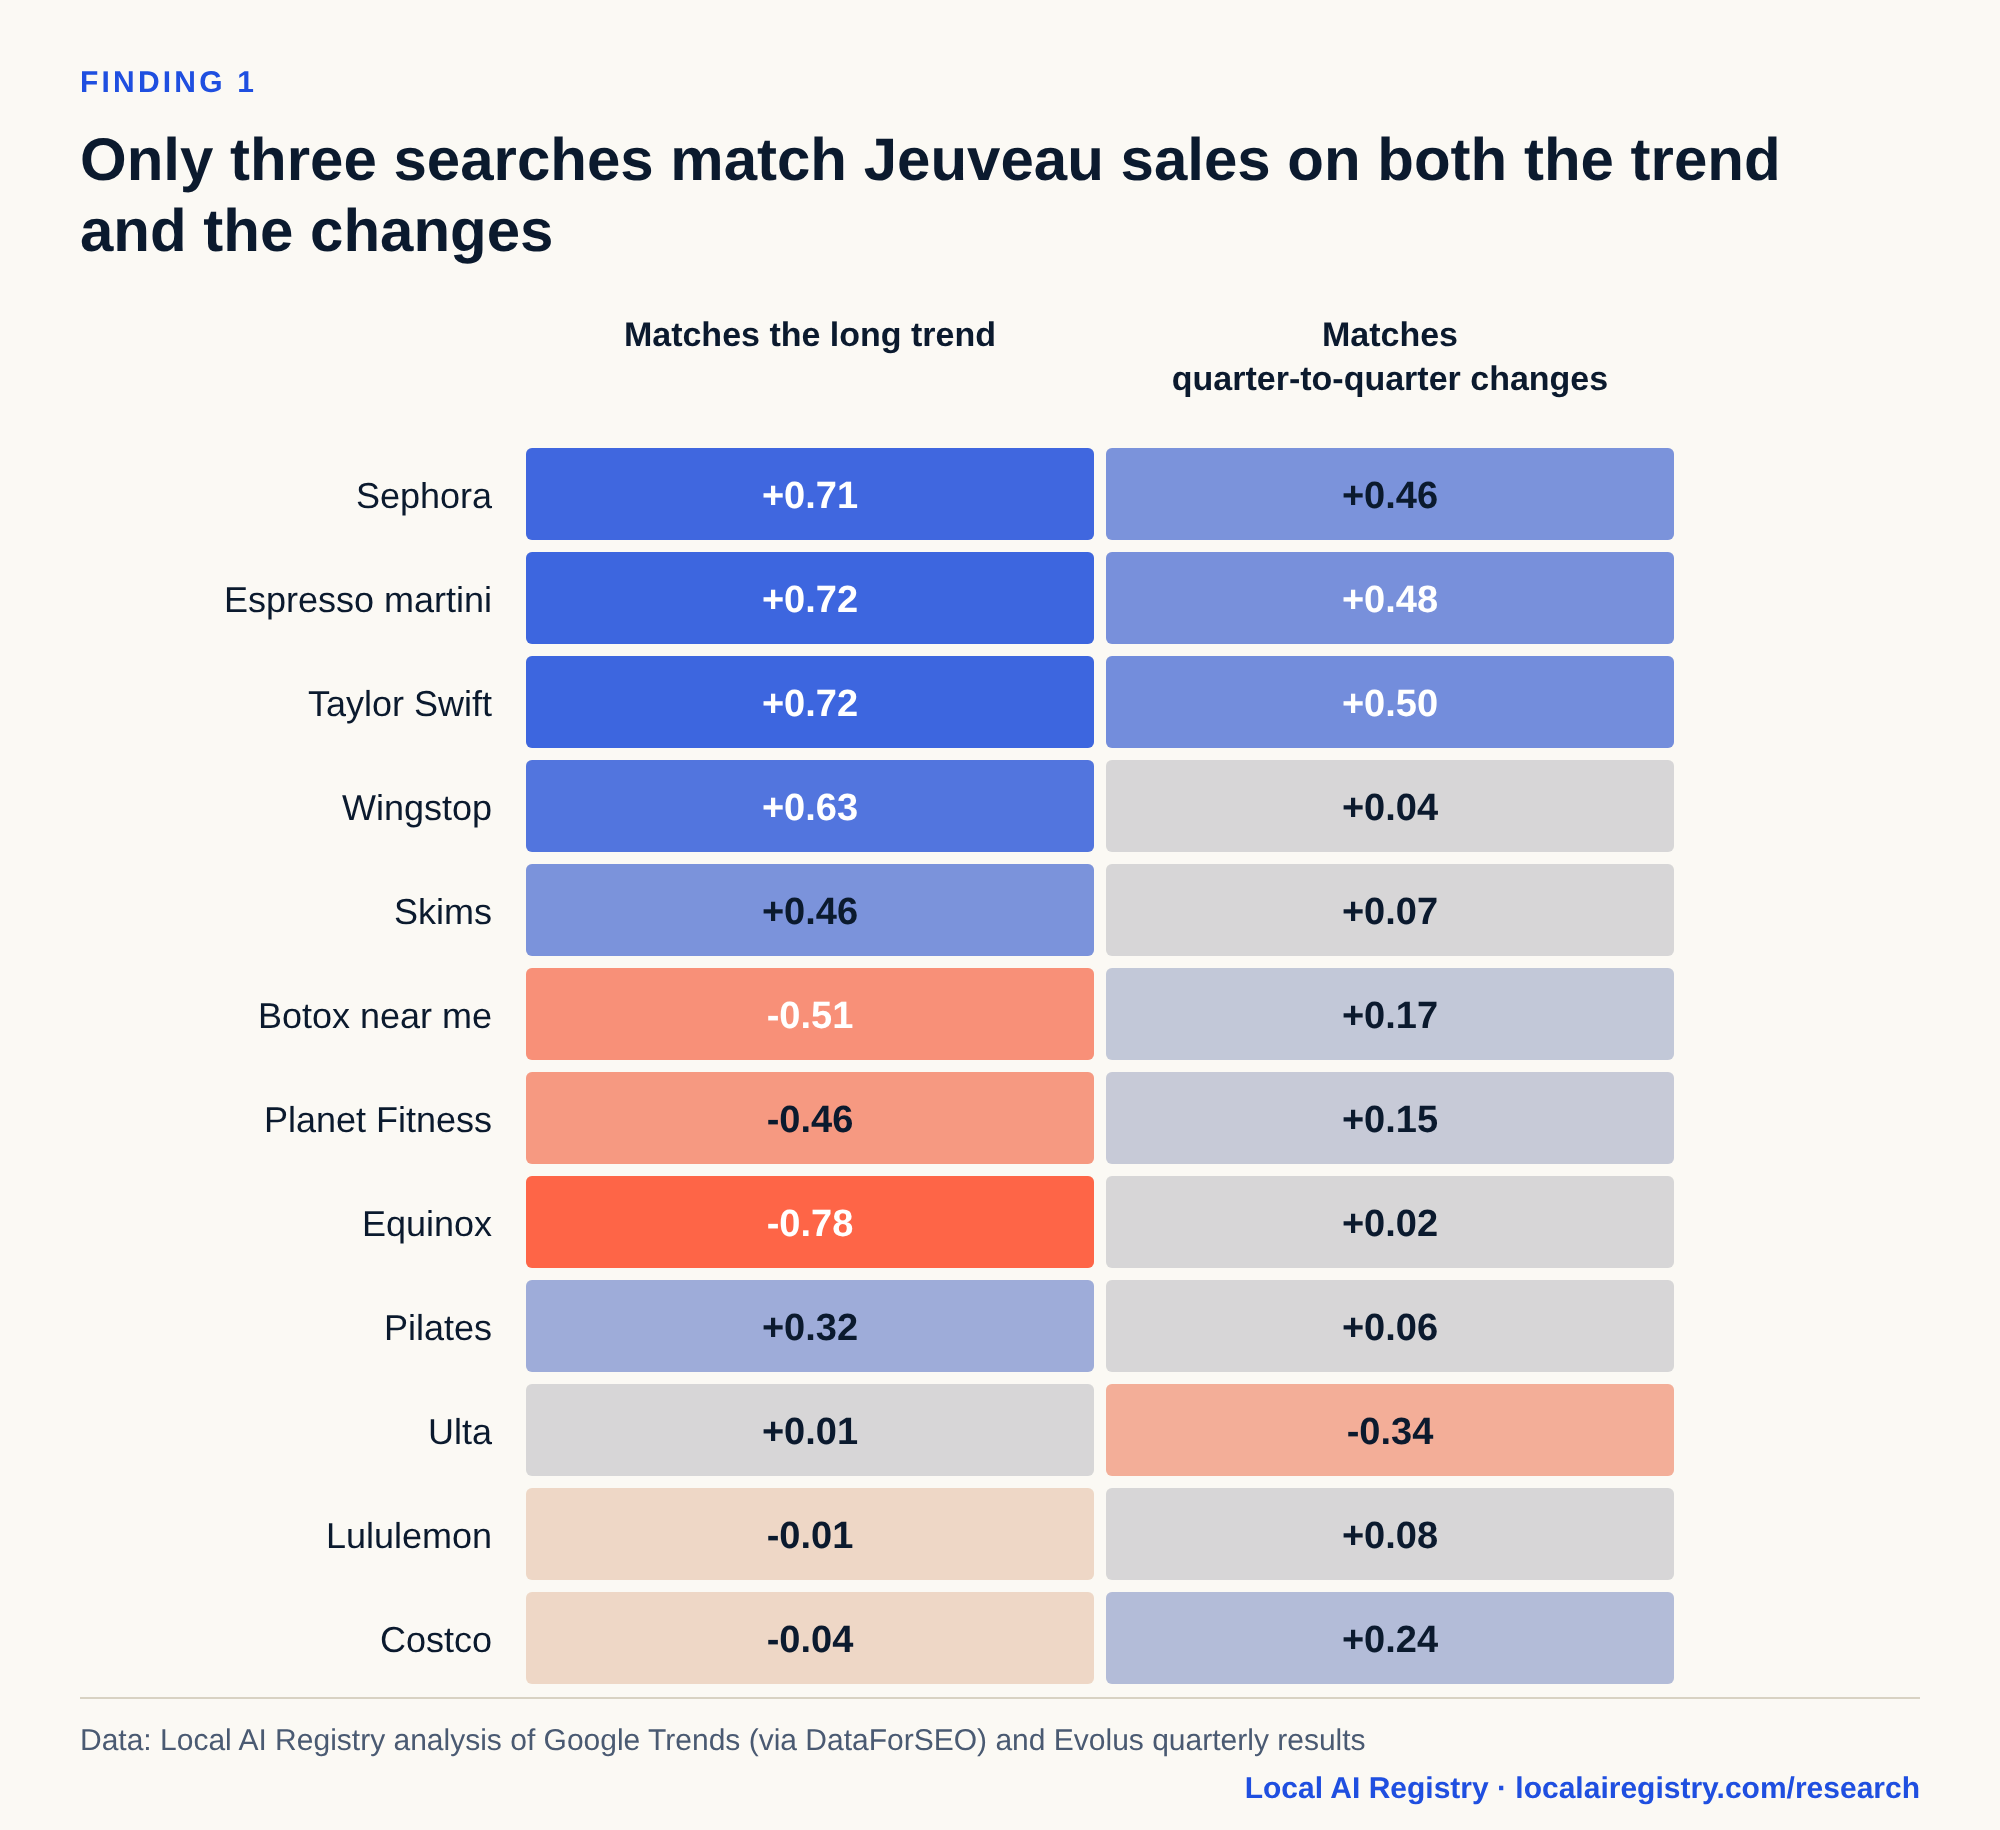
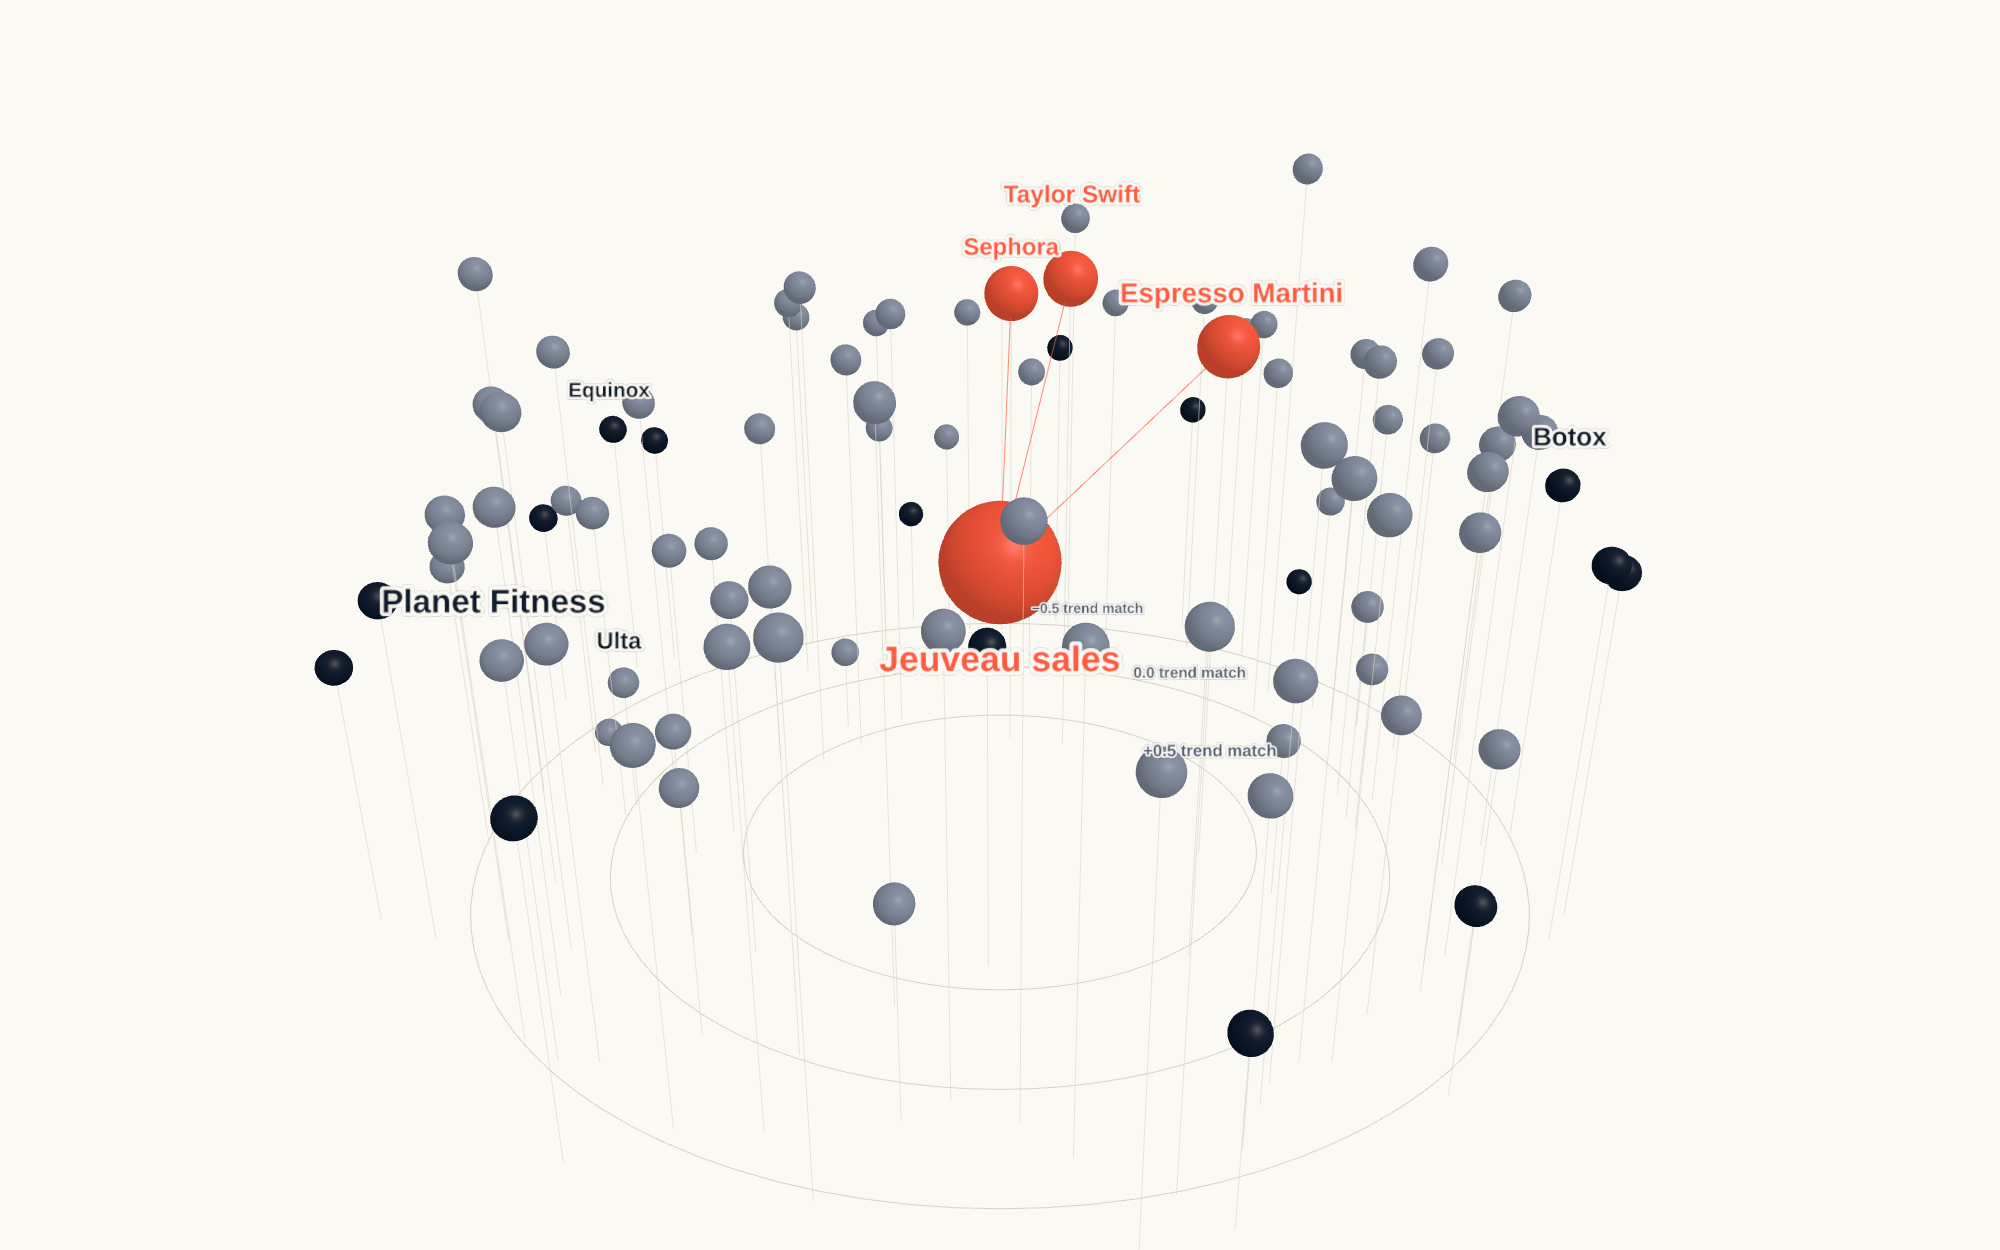
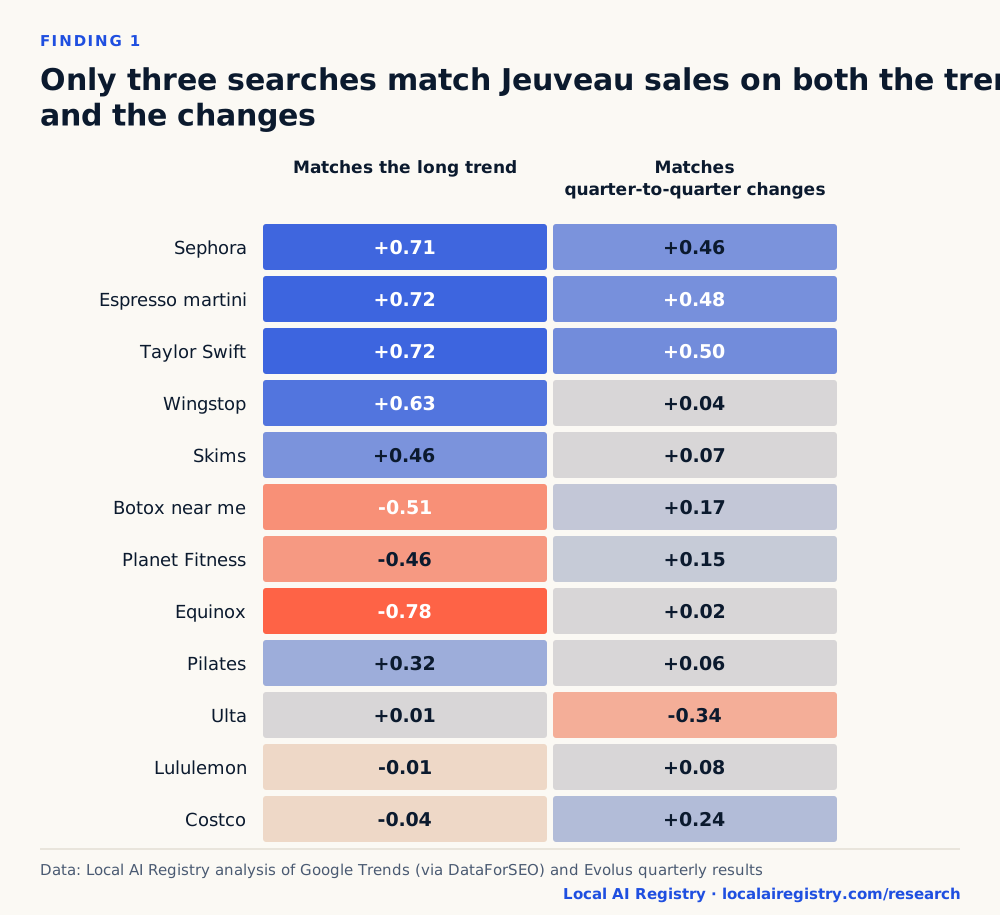
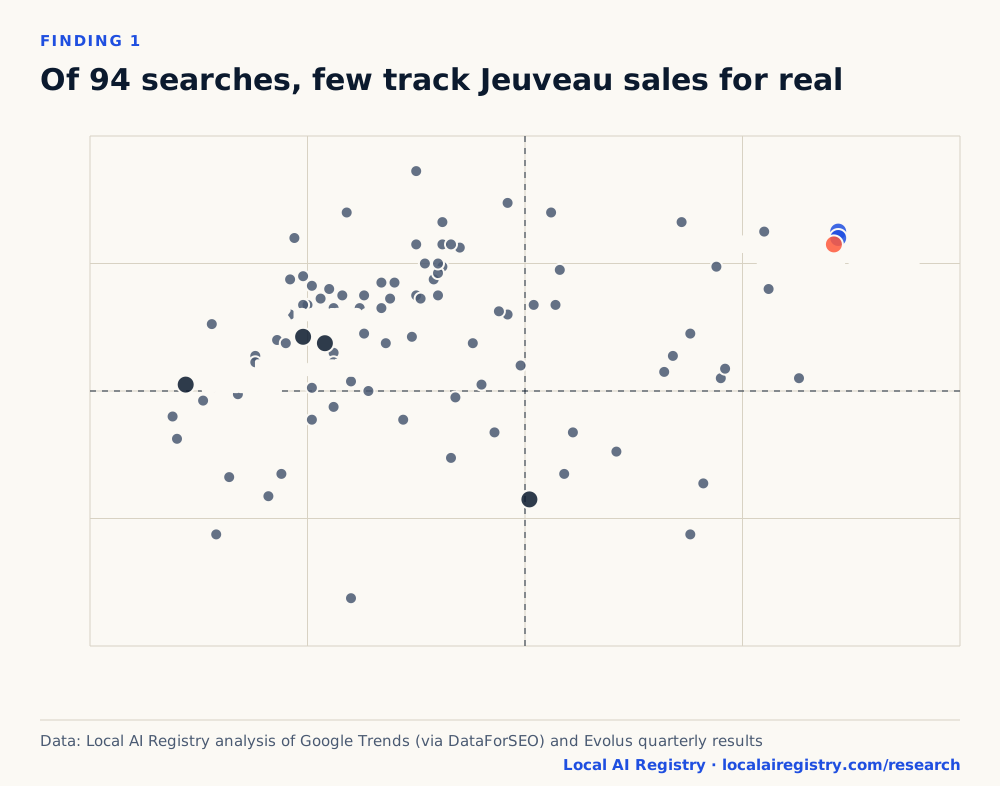
We tested 94 searches, from Sephora and Ulta to Equinox, Pilates, Wingstop and Taylor Swift. Three passed both tests: Sephora, espresso martini and Taylor Swift. Testing this many searches means some will match by luck, so we only use a stand-in with a real link to the same shopper. Of the three, only Sephora has one.
Data behind this chart
| Search | Long-trend match | Quarter-to-quarter match | Error on the last 5 quarters (points) |
|---|---|---|---|
| Sephora | 0.71 | 0.46 | 9.7 |
| Espresso martini | 0.72 | 0.48 | 11.5 |
| Taylor Swift | 0.72 | 0.5 | 9.5 |
| Wingstop | 0.63 | 0.04 | 8.7 |
| Skims | 0.46 | 0.07 | 14.4 |
| Botox near me | -0.51 | 0.17 | 8.1 |
| Planet Fitness | -0.46 | 0.15 | 9.8 |
| Equinox | -0.78 | 0.02 | 9.0 |
| Pilates | 0.32 | 0.06 | 16.1 |
| Ulta | 0.01 | -0.34 | 16.6 |
| Lululemon | -0.01 | 0.08 | 18.1 |
| Costco | -0.04 | 0.24 | 15.5 |
Data behind this chart
| Search | Long-trend match | Quarter-to-quarter match |
|---|---|---|
| taylor swift | 0.72 | 0.5 |
| espresso martini | 0.72 | 0.48 |
| sephora | 0.71 | 0.46 |
| wingstop | 0.63 | 0.04 |
| pickleball | 0.56 | 0.32 |
| dermaplaning | 0.55 | 0.5 |
| skims | 0.46 | 0.07 |
| trader joes | 0.45 | 0.04 |
| situationship | 0.44 | 0.39 |
| ozempic | 0.41 | -0.29 |
| sourdough | 0.38 | 0.18 |
| aperol spritz | 0.38 | -0.45 |
| bumble | 0.36 | 0.53 |
| lip filler | 0.34 | 0.11 |
| pilates | 0.32 | 0.06 |
| boba near me | 0.21 | -0.19 |
| chick fil a | 0.11 | -0.13 |
| orangetheory | 0.09 | -0.26 |
| nose job | 0.08 | 0.38 |
| tequila | 0.07 | 0.27 |
| margarita | 0.06 | 0.56 |
| tesla | 0.02 | 0.27 |
| ulta | 0.01 | -0.34 |
| lululemon | -0.01 | 0.08 |
| wordle | -0.04 | 0.59 |
| costco | -0.04 | 0.24 |
| white claw | -0.06 | 0.25 |
| charcuterie board | -0.07 | -0.13 |
| cheesecake factory | -0.1 | 0.02 |
| med spa near me | -0.12 | 0.15 |
| uber eats | -0.15 | 0.45 |
| crockpot | -0.16 | -0.02 |
| horoscope | -0.17 | -0.21 |
| engagement ring | -0.17 | 0.46 |
| hot dog | -0.19 | 0.53 |
| protein powder | -0.19 | 0.46 |
| tinder | -0.19 | 0.39 |
| kayak | -0.2 | 0.3 |
| printer ink | -0.2 | 0.37 |
| mattress | -0.2 | 0.4 |
| tarot | -0.21 | 0.35 |
| laser hair removal | -0.23 | 0.4 |
| true crime | -0.24 | 0.29 |
| lash extensions | -0.25 | 0.3 |
| taco bell | -0.25 | 0.69 |
| chemical peel | -0.25 | 0.46 |
| golf | -0.26 | 0.17 |
| golden retriever | -0.28 | -0.09 |
| hot tub | -0.3 | 0.34 |
| car wash near me | -0.31 | 0.29 |
| hinge app | -0.32 | 0.15 |
| beer | -0.33 | 0.26 |
| fishing license | -0.33 | 0.34 |
| fantasy football | -0.36 | -0.0 |
| starbucks | -0.37 | 0.18 |
| tiktok | -0.37 | 0.3 |
| hydrafacial | -0.38 | 0.26 |
| real housewives | -0.4 | 0.03 |
| love island | -0.4 | -0.65 |
| spray tan | -0.41 | 0.56 |
| iced coffee | -0.42 | 0.3 |
| ice cream near me | -0.44 | -0.05 |
| wine | -0.44 | 0.12 |
| candles | -0.44 | 0.09 |
| air fryer | -0.44 | 0.26 |
| astrology | -0.45 | 0.32 |
| rolex | -0.46 | 0.24 |
| planet fitness | -0.46 | 0.15 |
| monster energy | -0.47 | 0.29 |
| pizza near me | -0.49 | -0.09 |
| sushi near me | -0.49 | 0.01 |
| divorce lawyer | -0.49 | 0.33 |
| microneedling | -0.5 | 0.27 |
| botox near me | -0.51 | 0.17 |
| puppy | -0.51 | 0.36 |
| oil change near me | -0.51 | 0.27 |
| crystals | -0.53 | 0.48 |
| brazilian wax | -0.54 | 0.35 |
| hair salon near me | -0.54 | 0.24 |
| wedding dress | -0.55 | 0.15 |
| matcha | -0.56 | -0.26 |
| teeth whitening | -0.57 | 0.16 |
| bath bombs | -0.59 | -0.33 |
| energy drink | -0.62 | 0.11 |
| therapist near me | -0.62 | 0.09 |
| facelift | -0.66 | -0.01 |
| liposuction | -0.68 | -0.27 |
| peloton | -0.71 | -0.45 |
| breast augmentation | -0.72 | 0.01 |
| eyebrow threading | -0.72 | 0.21 |
| doordash | -0.74 | -0.03 |
| equinox | -0.78 | 0.02 |
| tummy tuck | -0.8 | -0.15 |
| nail salon near me | -0.81 | -0.08 |
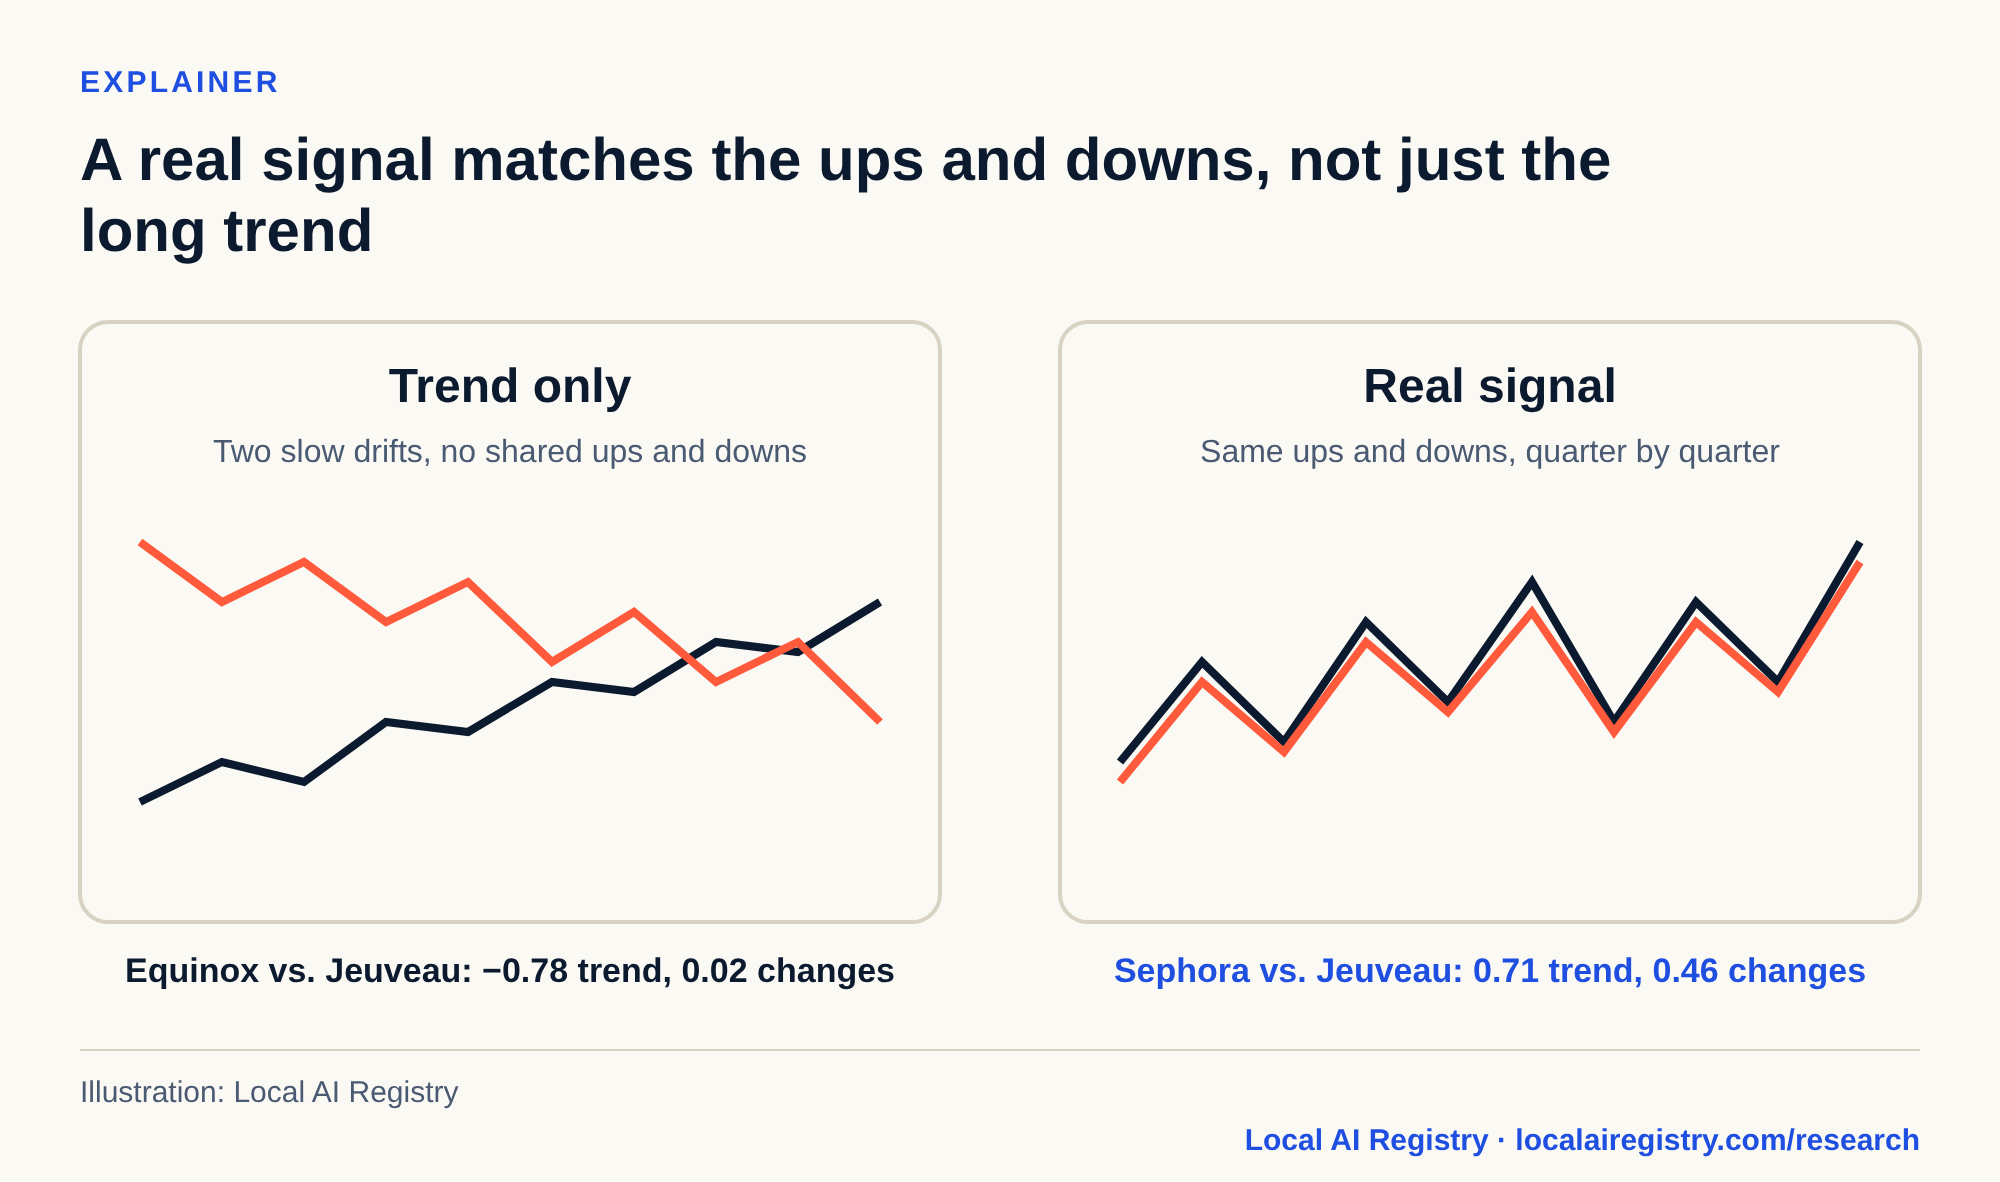
Equinox is the trap. Over five years its searches move opposite to Jeuveau sales (−0.78), which looks like a gym-versus-injectables budget fight. Quarter to quarter there is no link (0.02). The match came from two slow trends pointing different ways. “Equinox” is also a car and a season, which muddies its searches further.
What do searches say about Jeuveau's Q4 2026 sales?
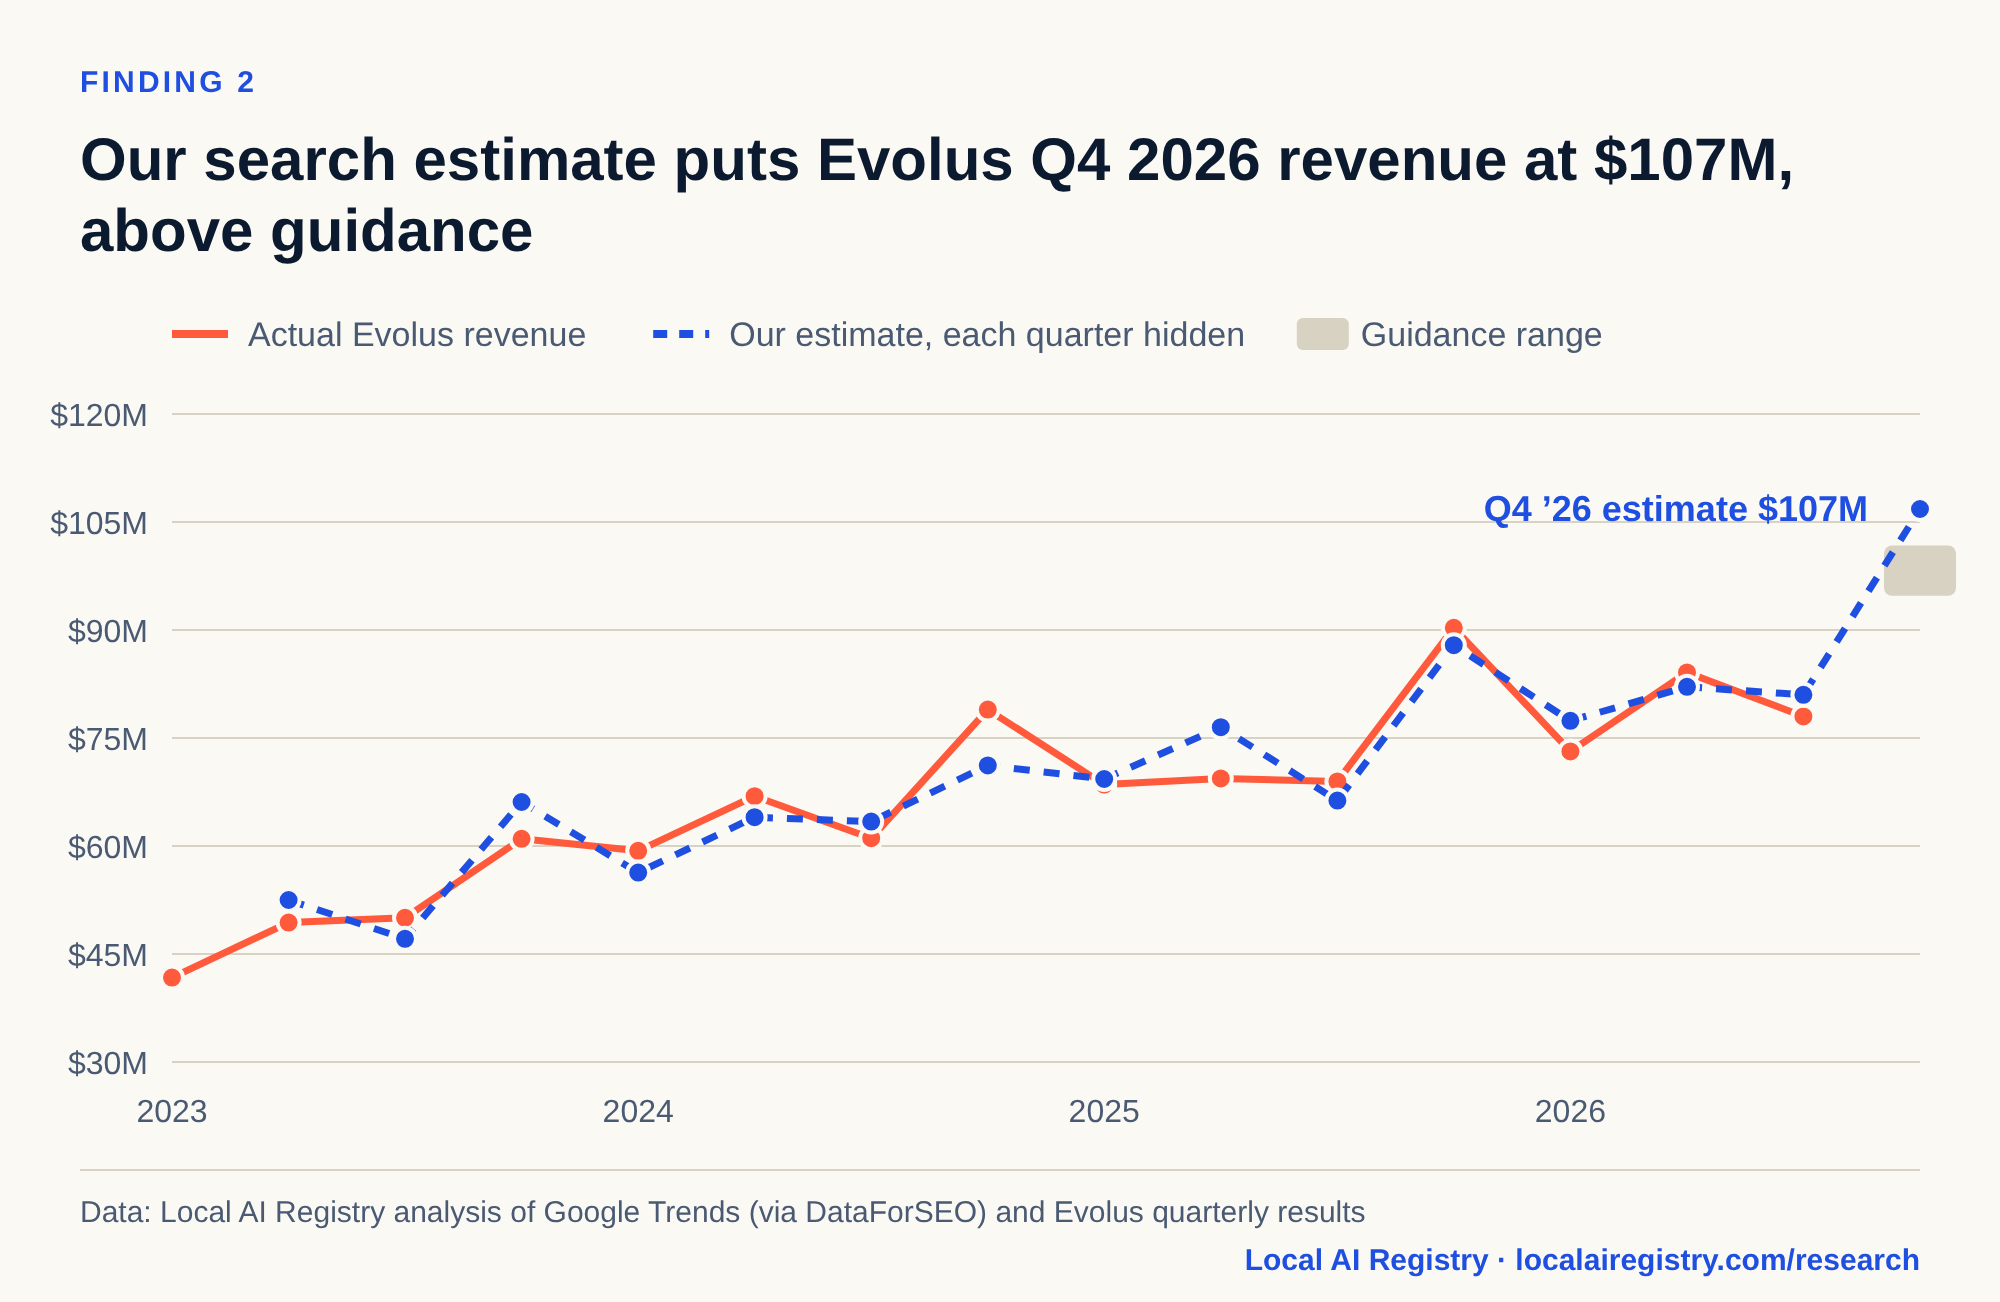
They point above guidance. Our estimate for Evolus’s Q4 2026 revenue is about $107 million; the company’s guidance implies $95 million to $102 million.
Data behind this chart
| Quarter | Actual revenue ($M) | Estimate ($M) |
|---|---|---|
| Q1 ’23 | 41.72 | |
| Q2 ’23 | 49.35 | 52.5 |
| Q3 ’23 | 50.02 | 47.1 |
| Q4 ’23 | 61.0 | 66.1 |
| Q1 ’24 | 59.33 | 56.3 |
| Q2 ’24 | 66.91 | 64.0 |
| Q3 ’24 | 61.09 | 63.4 |
| Q4 ’24 | 78.95 | 71.2 |
| Q1 ’25 | 68.52 | 69.3 |
| Q2 ’25 | 69.39 | 76.5 |
| Q3 ’25 | 68.97 | 66.3 |
| Q4 ’25 | 90.3 | 87.9 |
| Q1 ’26 | 73.14 | 77.4 |
| Q2 ’26 | 84.1 | 82.1 |
| Q3 ’26 | 78.0 | 81.0 |
| Q4 ’26 | Not yet reported | 106.8 |
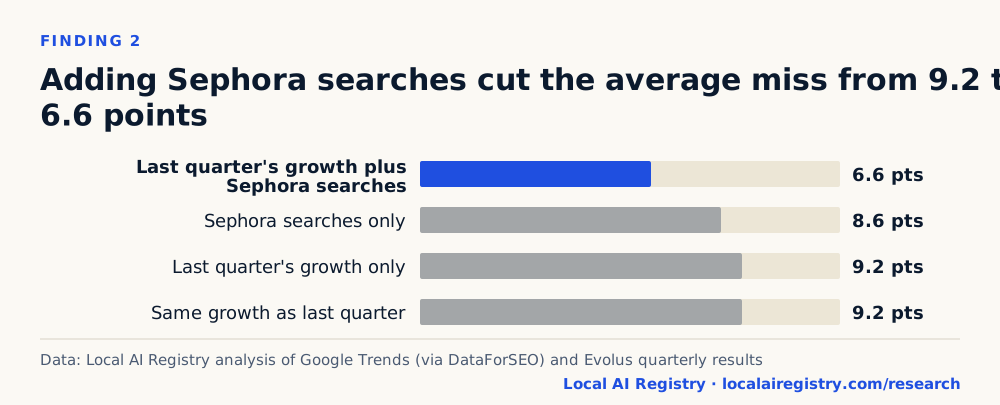
Sephora searches from October 4 to November 14, 2026, are up 7.5% on the same weeks of 2025. With last quarter’s growth of 13.1%, that points to Q4 revenue up about 18%, roughly $101 million to $113 million. Evolus guided to $330 million to $337 million for 2026 and has reported $235.2 million through Q3.
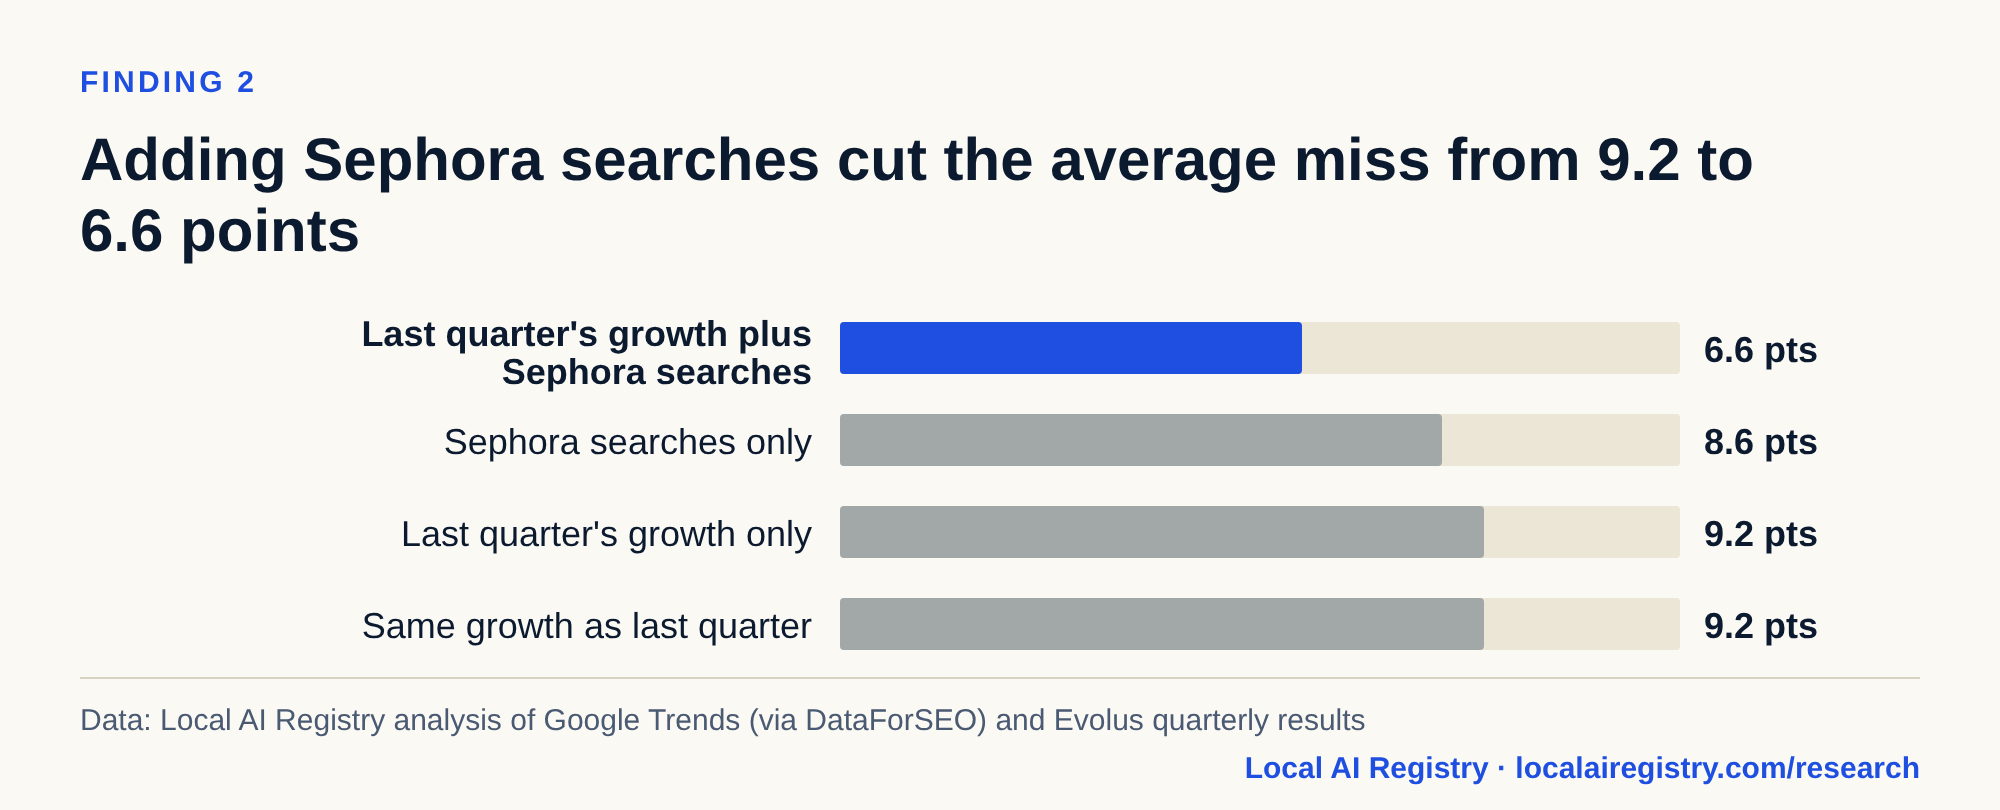
Data behind this chart
| Method | Average miss (points of growth) |
|---|---|
| Last quarter's growth plus Sephora searches | 6.6 |
| Sephora searches only | 8.6 |
| Last quarter's growth only | 9.2 |
| Same growth as last quarter | 9.2 |
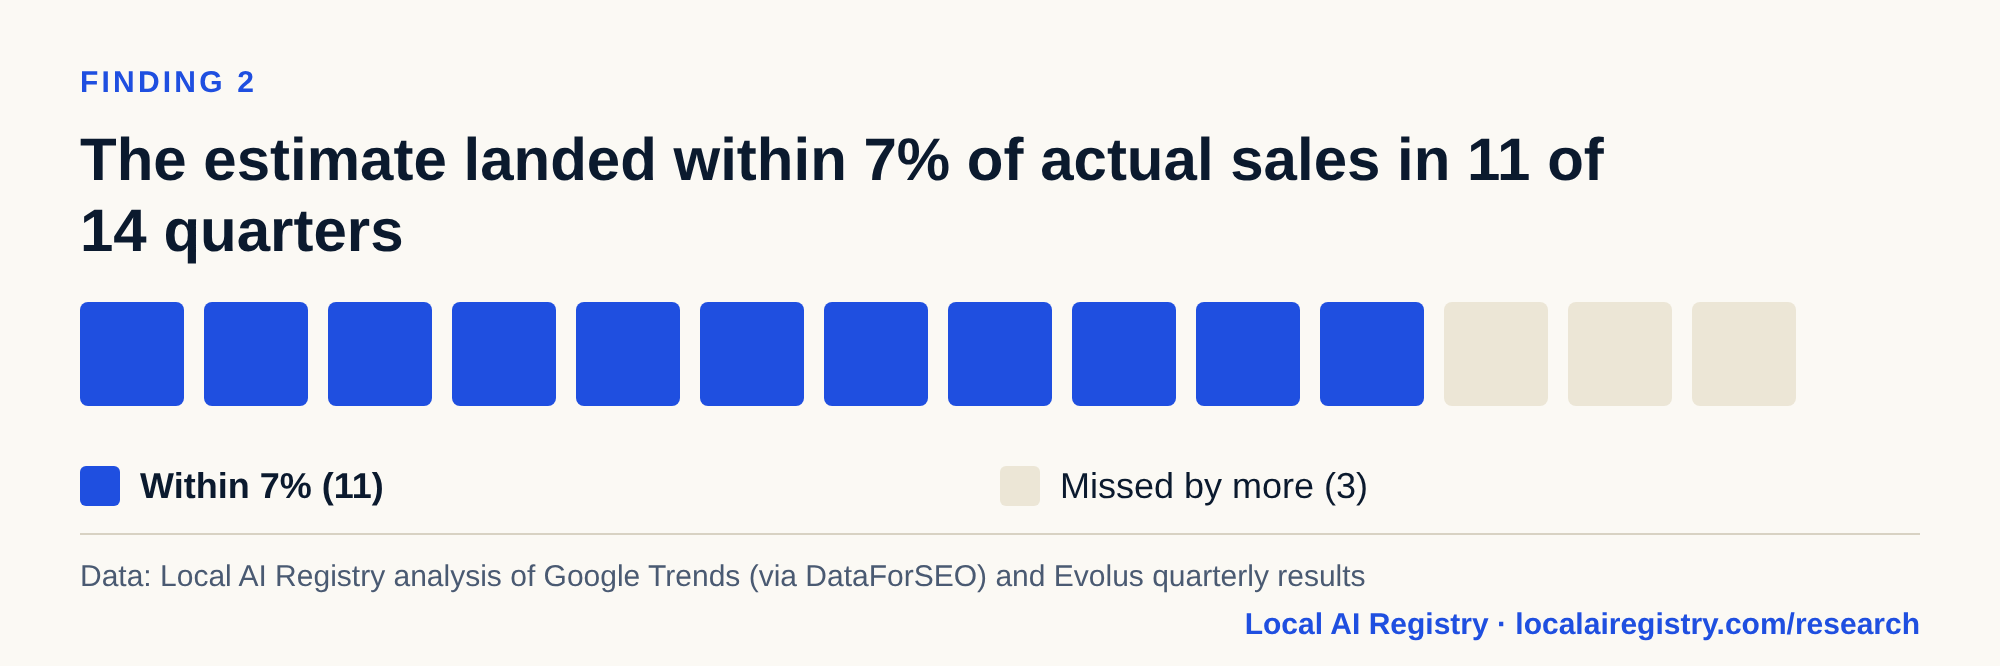
Data behind this chart
| Quarters tested | Within 7% | Further off |
|---|---|---|
| 14 | 11 | 3 |
Search moved in the same quarter as sales in our tests, not a quarter ahead. So this is an early read, available about seven weeks before Evolus last shared preliminary Q4 numbers (January 9, 2026). It is research, not investment advice.
Do searches for a brand track that brand's sales?
For brand names, yes. For category words, no. “botox” rose in 2025 while Botox Cosmetic sales fell; Jeuveau searches matched Evolus’s sales direction in 10 of 11 quarters.
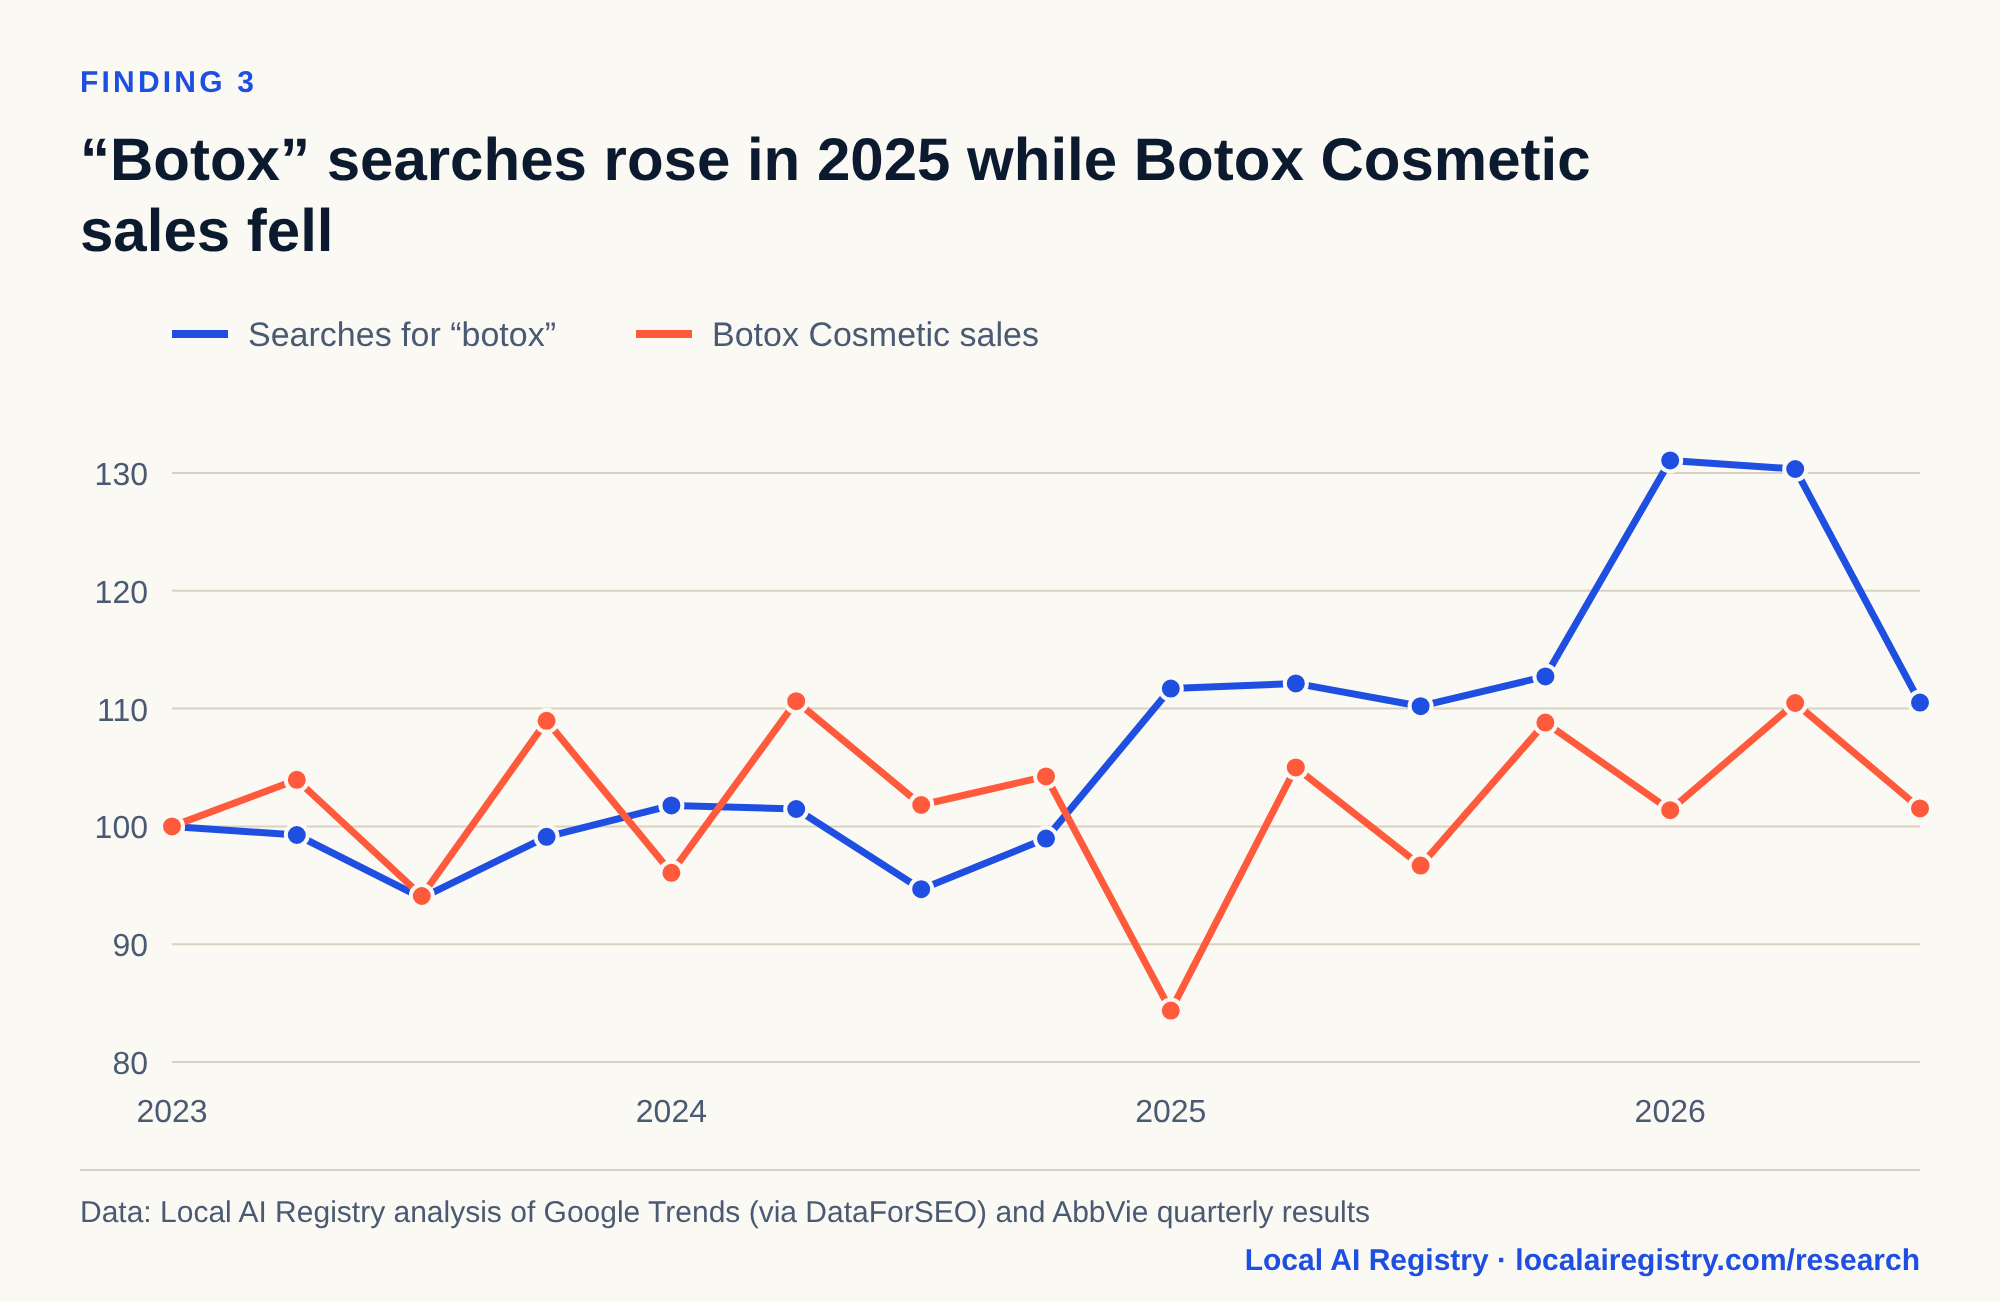
Data behind this chart
| Quarter | Botox search (avg weekly index) | Botox Cosmetic sales ($M) |
|---|---|---|
| Q1 ’23 | 67.6 | 659 |
| Q2 ’23 | 67.1 | 685 |
| Q3 ’23 | 63.5 | 620 |
| Q4 ’23 | 67.0 | 718 |
| Q1 ’24 | 68.8 | 633 |
| Q2 ’24 | 68.6 | 729 |
| Q3 ’24 | 64.0 | 671 |
| Q4 ’24 | 66.9 | 687 |
| Q1 ’25 | 75.5 | 556 |
| Q2 ’25 | 75.8 | 692 |
| Q3 ’25 | 74.5 | 637 |
| Q4 ’25 | 76.2 | 717 |
| Q1 ’26 | 88.6 | 668 |
| Q2 ’26 | 88.1 | 728 |
| Q3 ’26 | 74.7 | 669 |
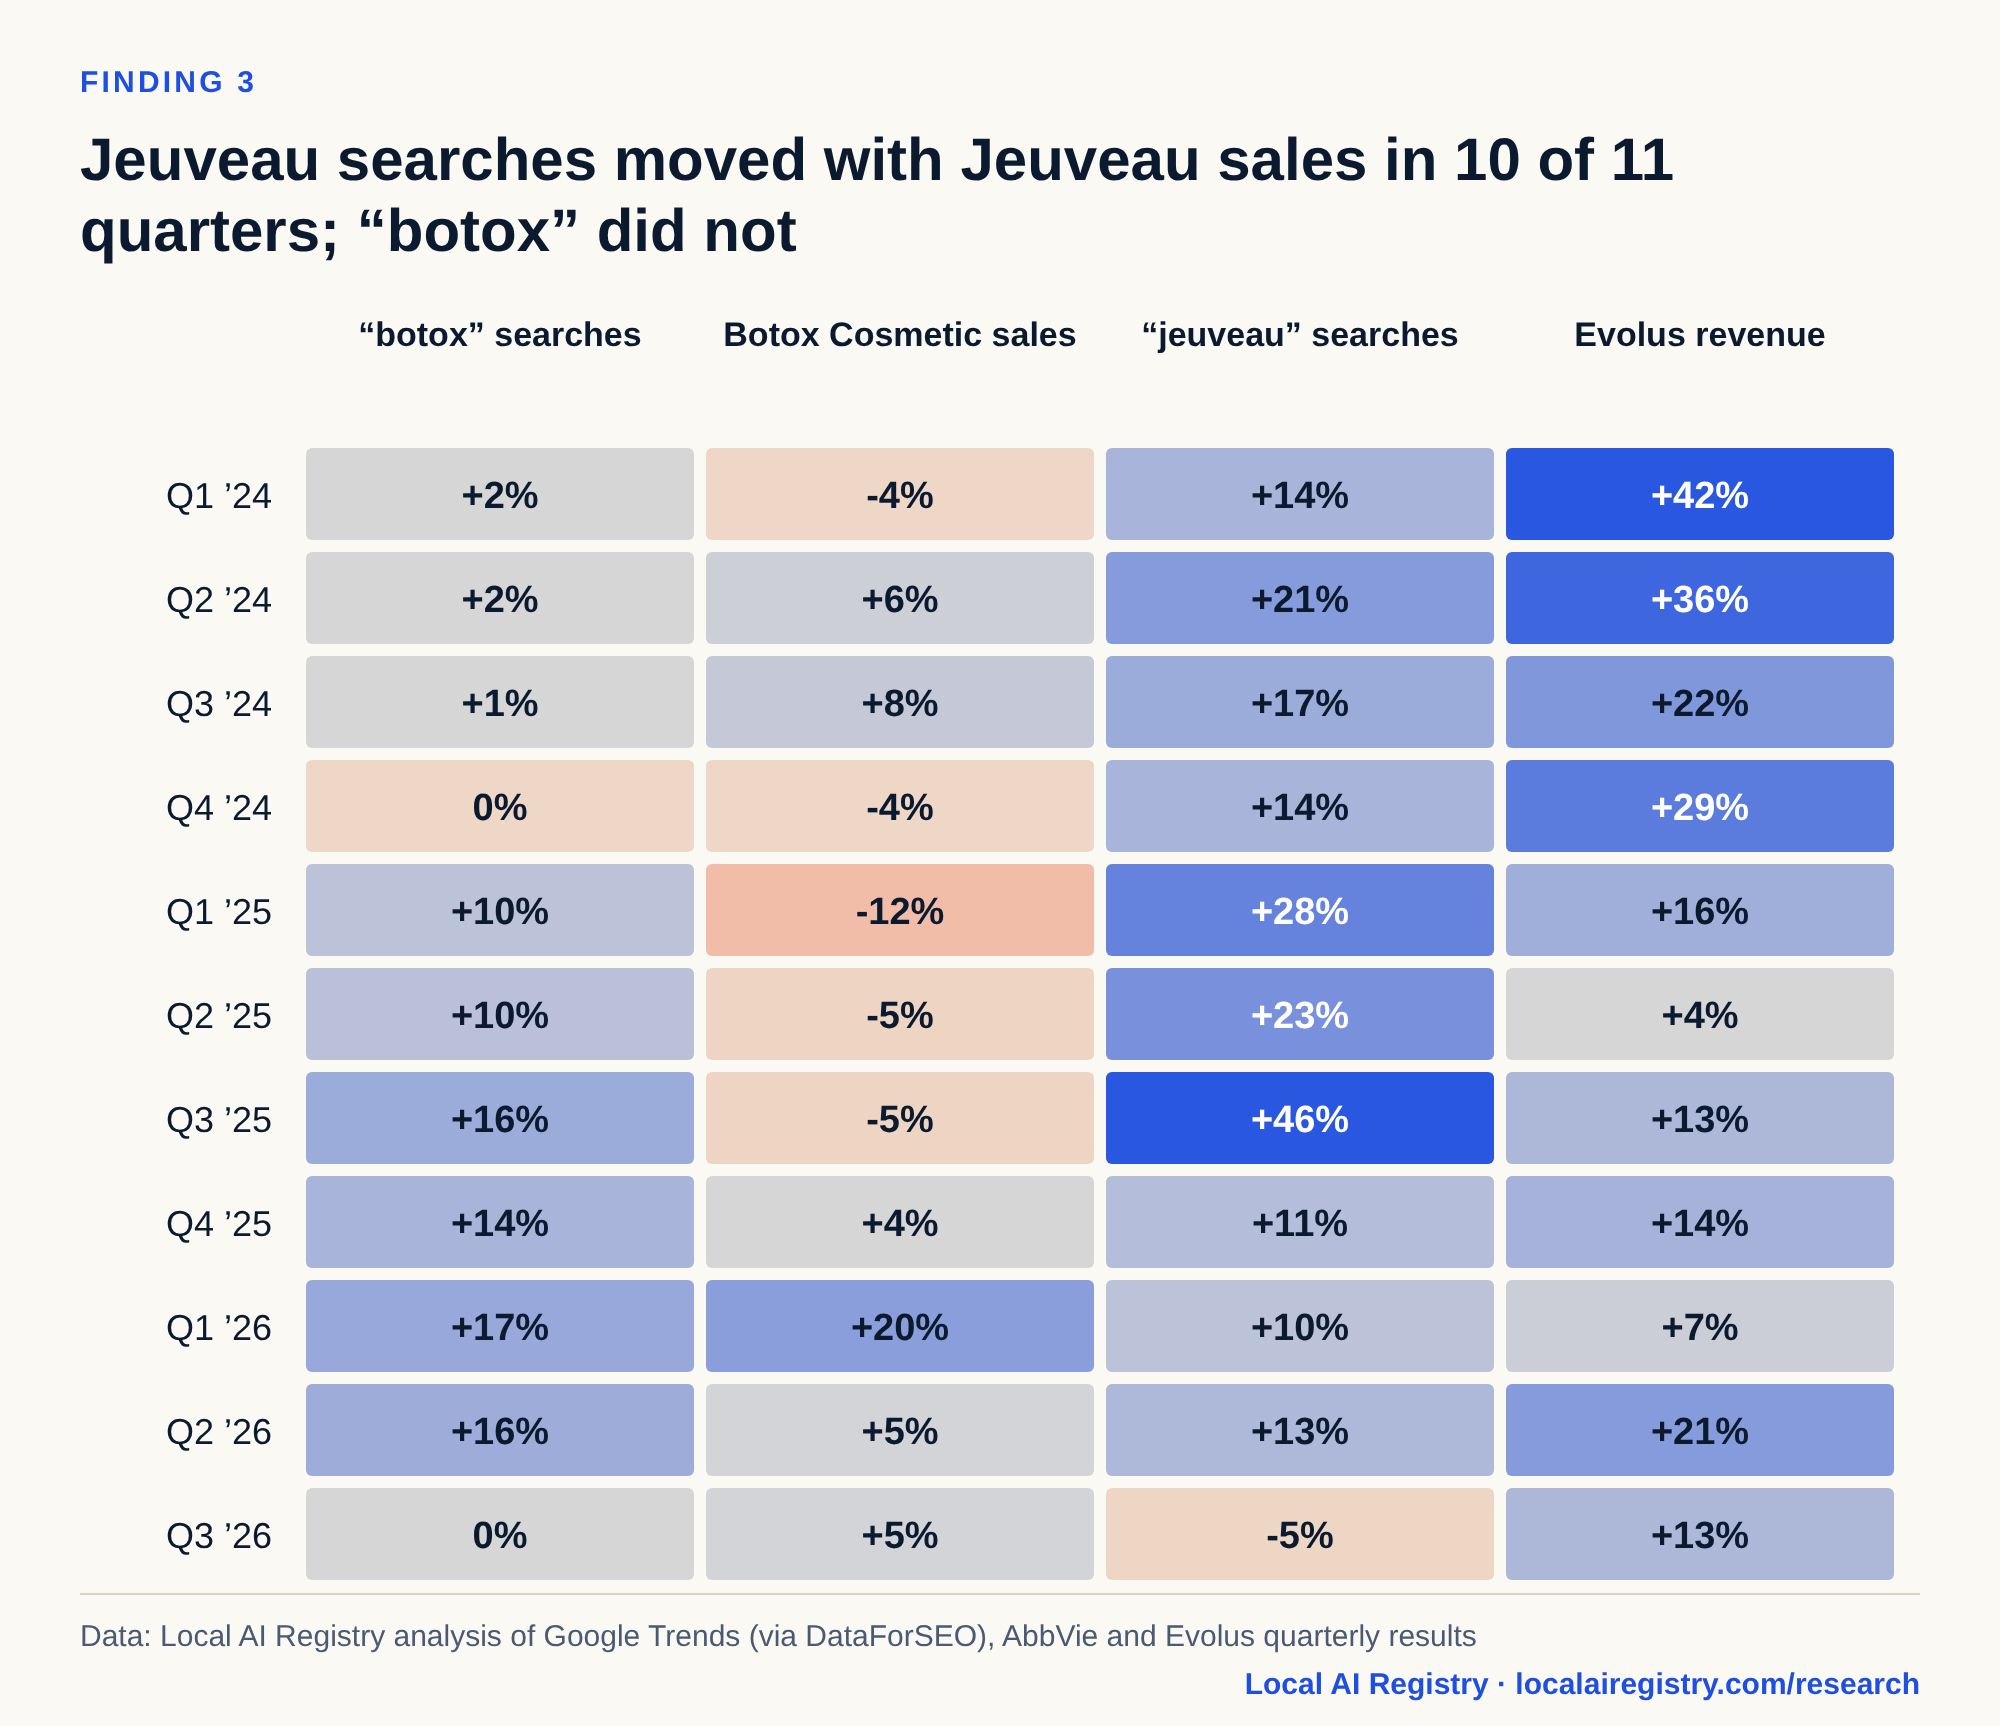
Data behind this chart
| Quarter | botox searches | Botox Cosmetic sales | jeuveau searches | Evolus revenue |
|---|---|---|---|---|
| Q1 ’24 | +1.7% | -3.9% | +13.7% | +42.2% |
| Q2 ’24 | +2.3% | +6.4% | +21.1% | +35.6% |
| Q3 ’24 | +0.7% | +8.2% | +16.6% | +22.1% |
| Q4 ’24 | -0.1% | -4.3% | +13.7% | +29.4% |
| Q1 ’25 | +9.7% | -12.2% | +27.9% | +15.5% |
| Q2 ’25 | +10.5% | -5.1% | +23.4% | +3.7% |
| Q3 ’25 | +16.3% | -5.1% | +45.7% | +12.9% |
| Q4 ’25 | +13.9% | +4.4% | +11.4% | +14.4% |
| Q1 ’26 | +17.4% | +20.1% | +9.7% | +6.7% |
| Q2 ’26 | +16.1% | +5.2% | +12.8% | +21.2% |
| Q3 ’26 | +0.3% | +5.0% | -4.8% | +13.1% |
Club Pilates shows the same rule from the other side. Brand searches grew 15% in Q1 2025, stalled by mid-2025 and fell 17% by Q3 2026. Xponential’s North America same-store sales turned negative in Q3 2025 (down 1%) and kept falling, to down 7.5% in Q3 2026 (Club Pilates down 5.6%). Plain “pilates” searches were still up 17% in Q2 2026. The category grew; the brand did not.
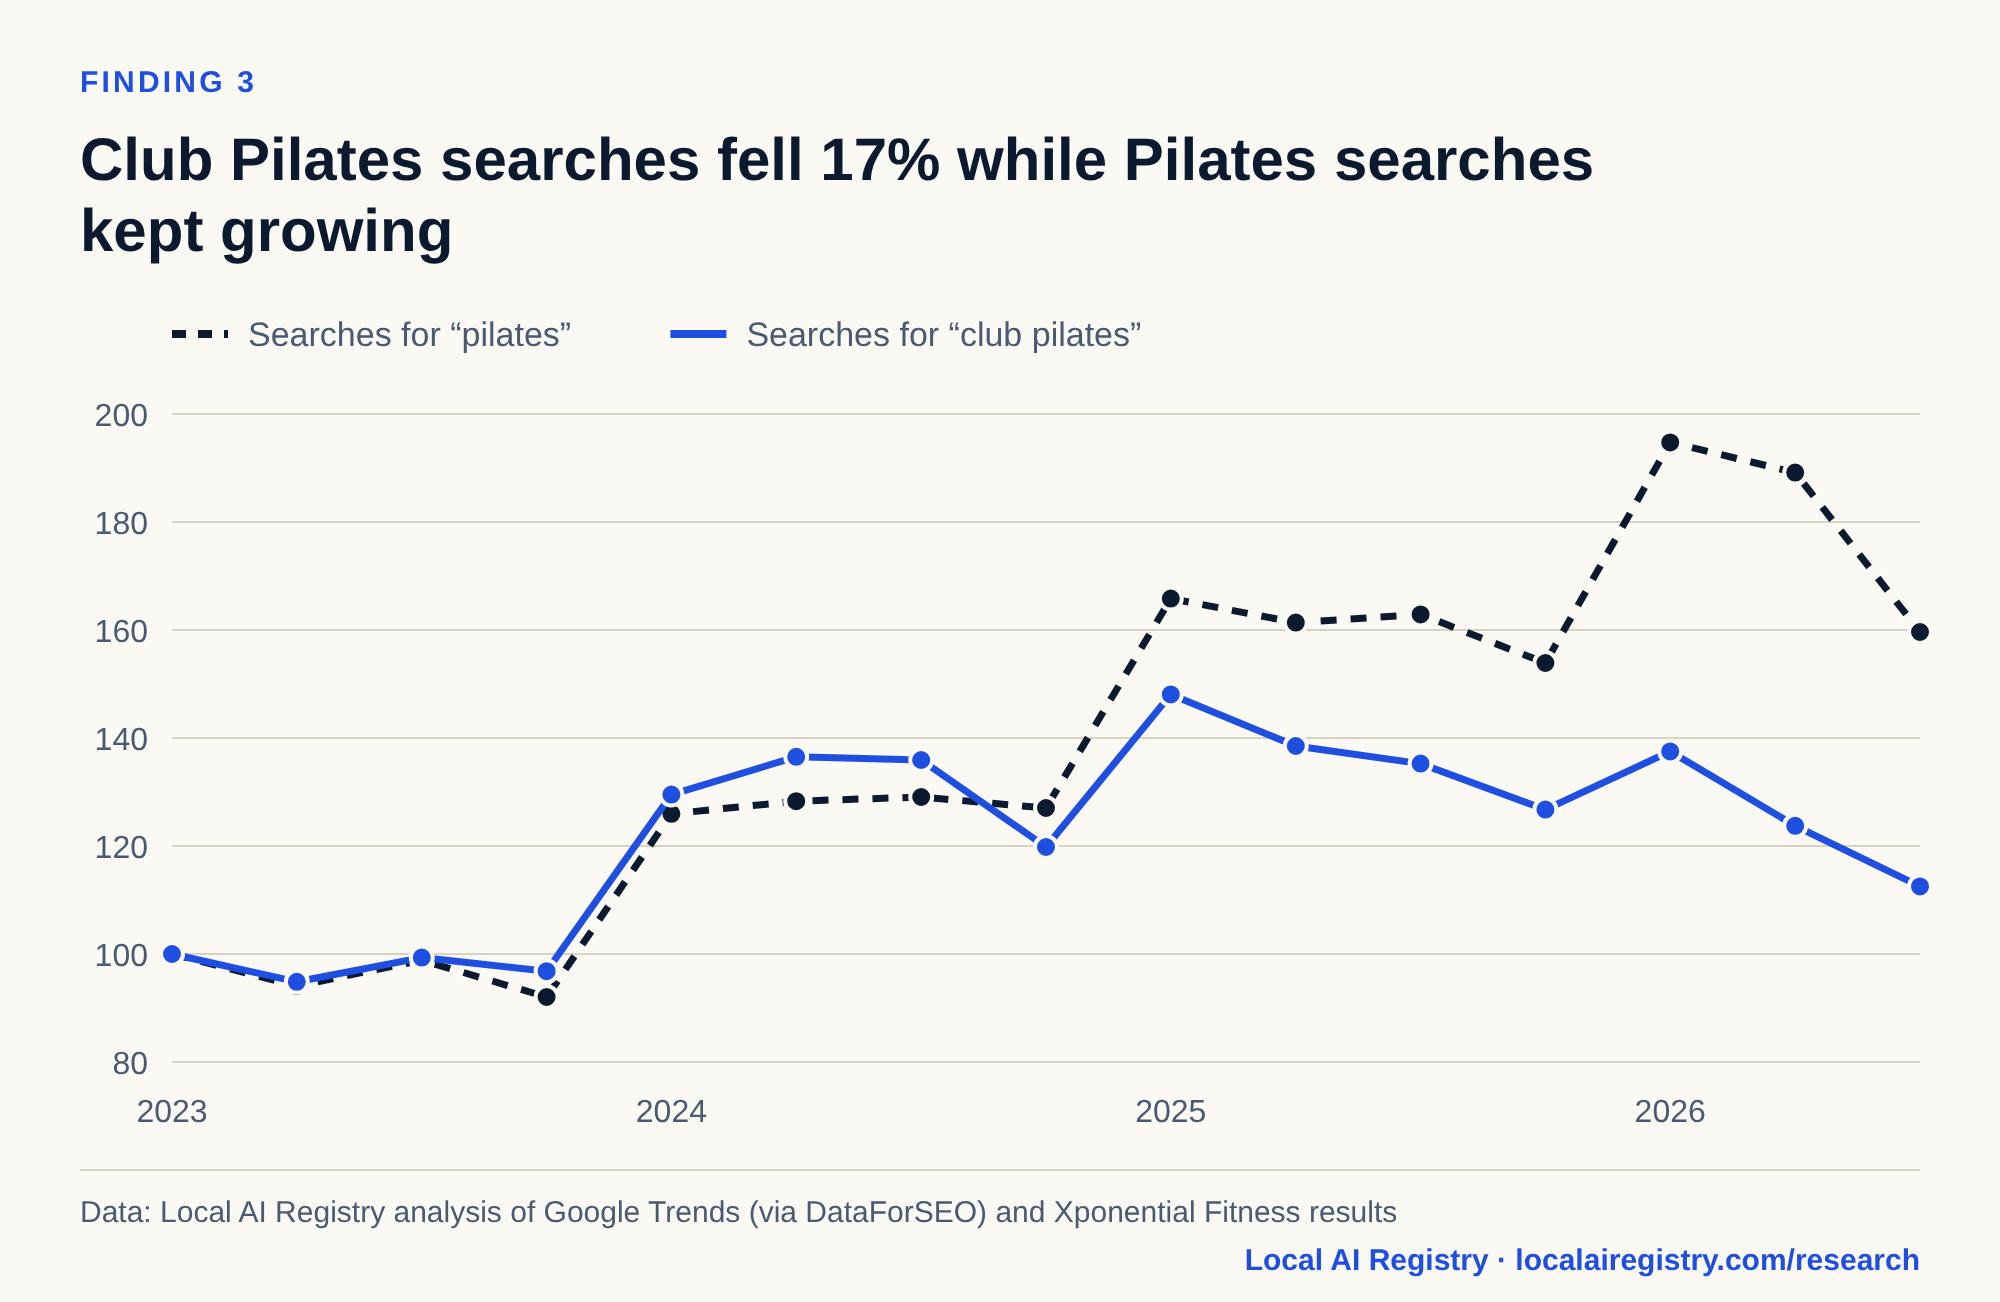
Data behind this chart
| Quarter | pilates (index) | club pilates (index) |
|---|---|---|
| Q1 ’23 | 100.0 | 100.0 |
| Q2 ’23 | 94.1 | 94.8 |
| Q3 ’23 | 98.8 | 99.3 |
| Q4 ’23 | 92.1 | 96.8 |
| Q1 ’24 | 126.0 | 129.5 |
| Q2 ’24 | 128.3 | 136.5 |
| Q3 ’24 | 129.1 | 135.9 |
| Q4 ’24 | 127.0 | 119.8 |
| Q1 ’25 | 165.8 | 148.1 |
| Q2 ’25 | 161.4 | 138.5 |
| Q3 ’25 | 162.9 | 135.2 |
| Q4 ’25 | 153.9 | 126.8 |
| Q1 ’26 | 194.7 | 137.5 |
| Q2 ’26 | 189.1 | 123.8 |
| Q3 ’26 | 159.6 | 112.5 |
Where do med spa clients live?
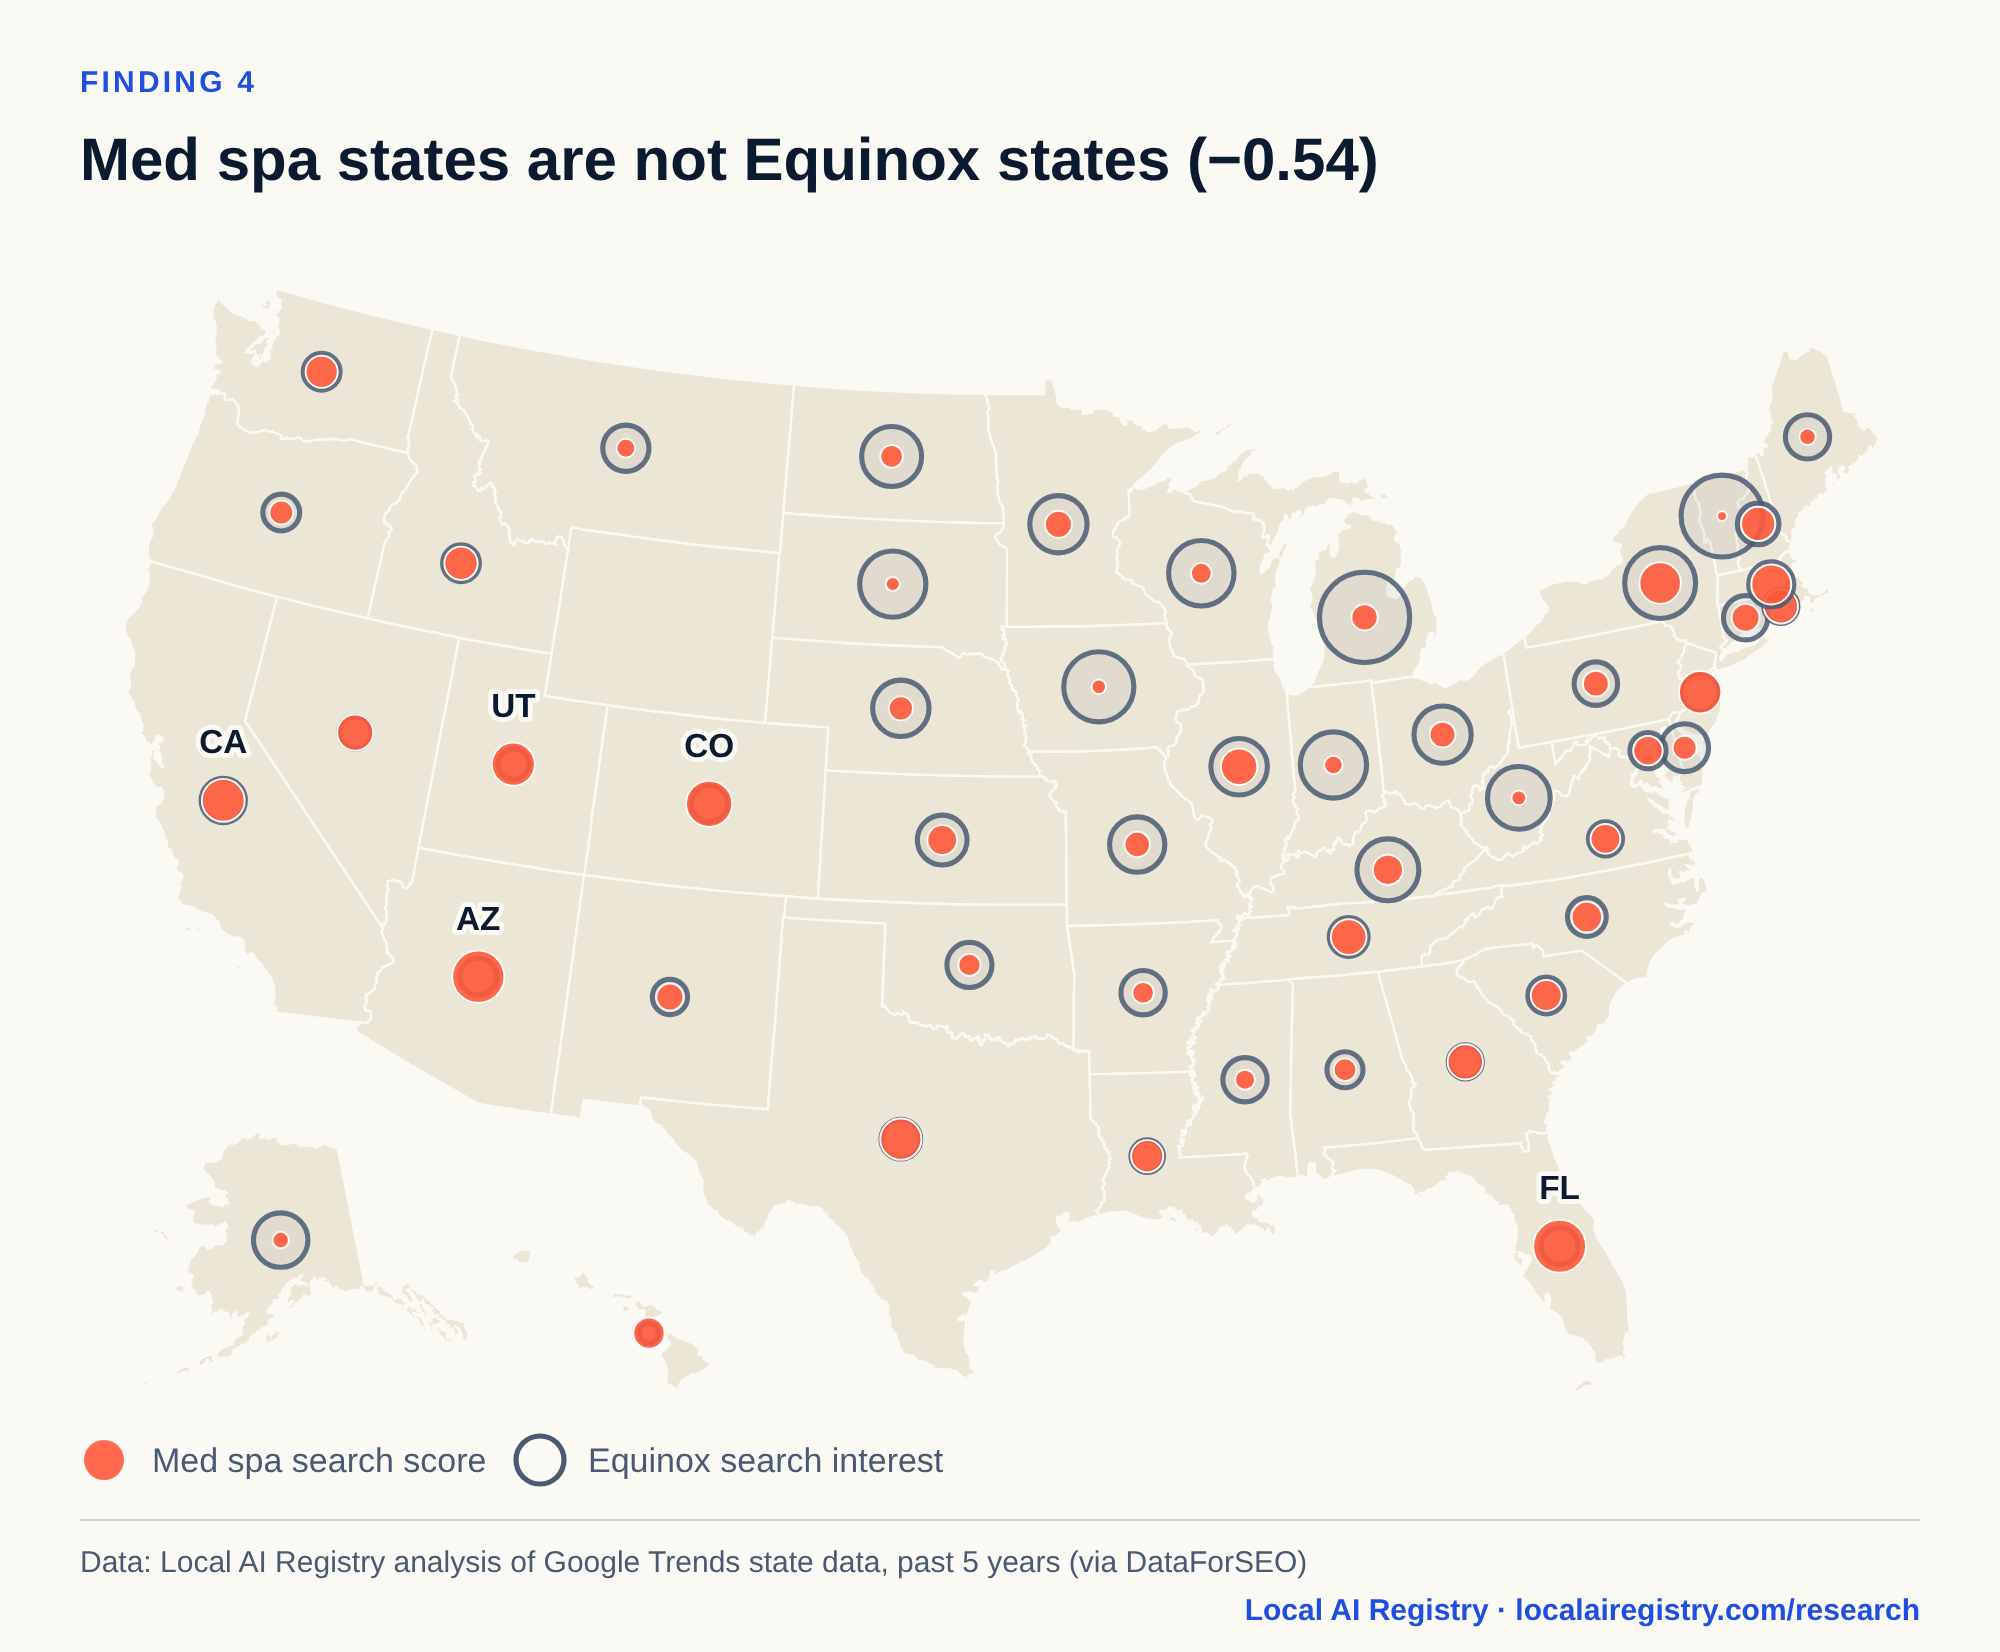
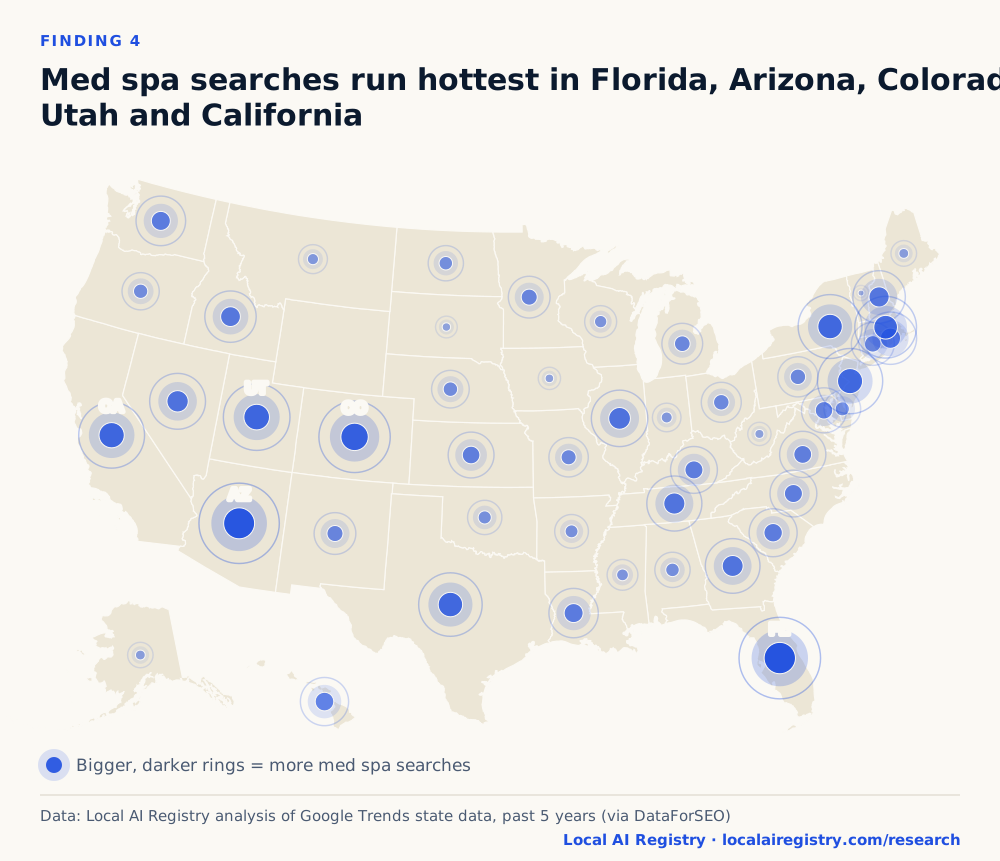
In the same states that search for Pilates. Our combined med spa score matches Pilates search by state at 0.81.
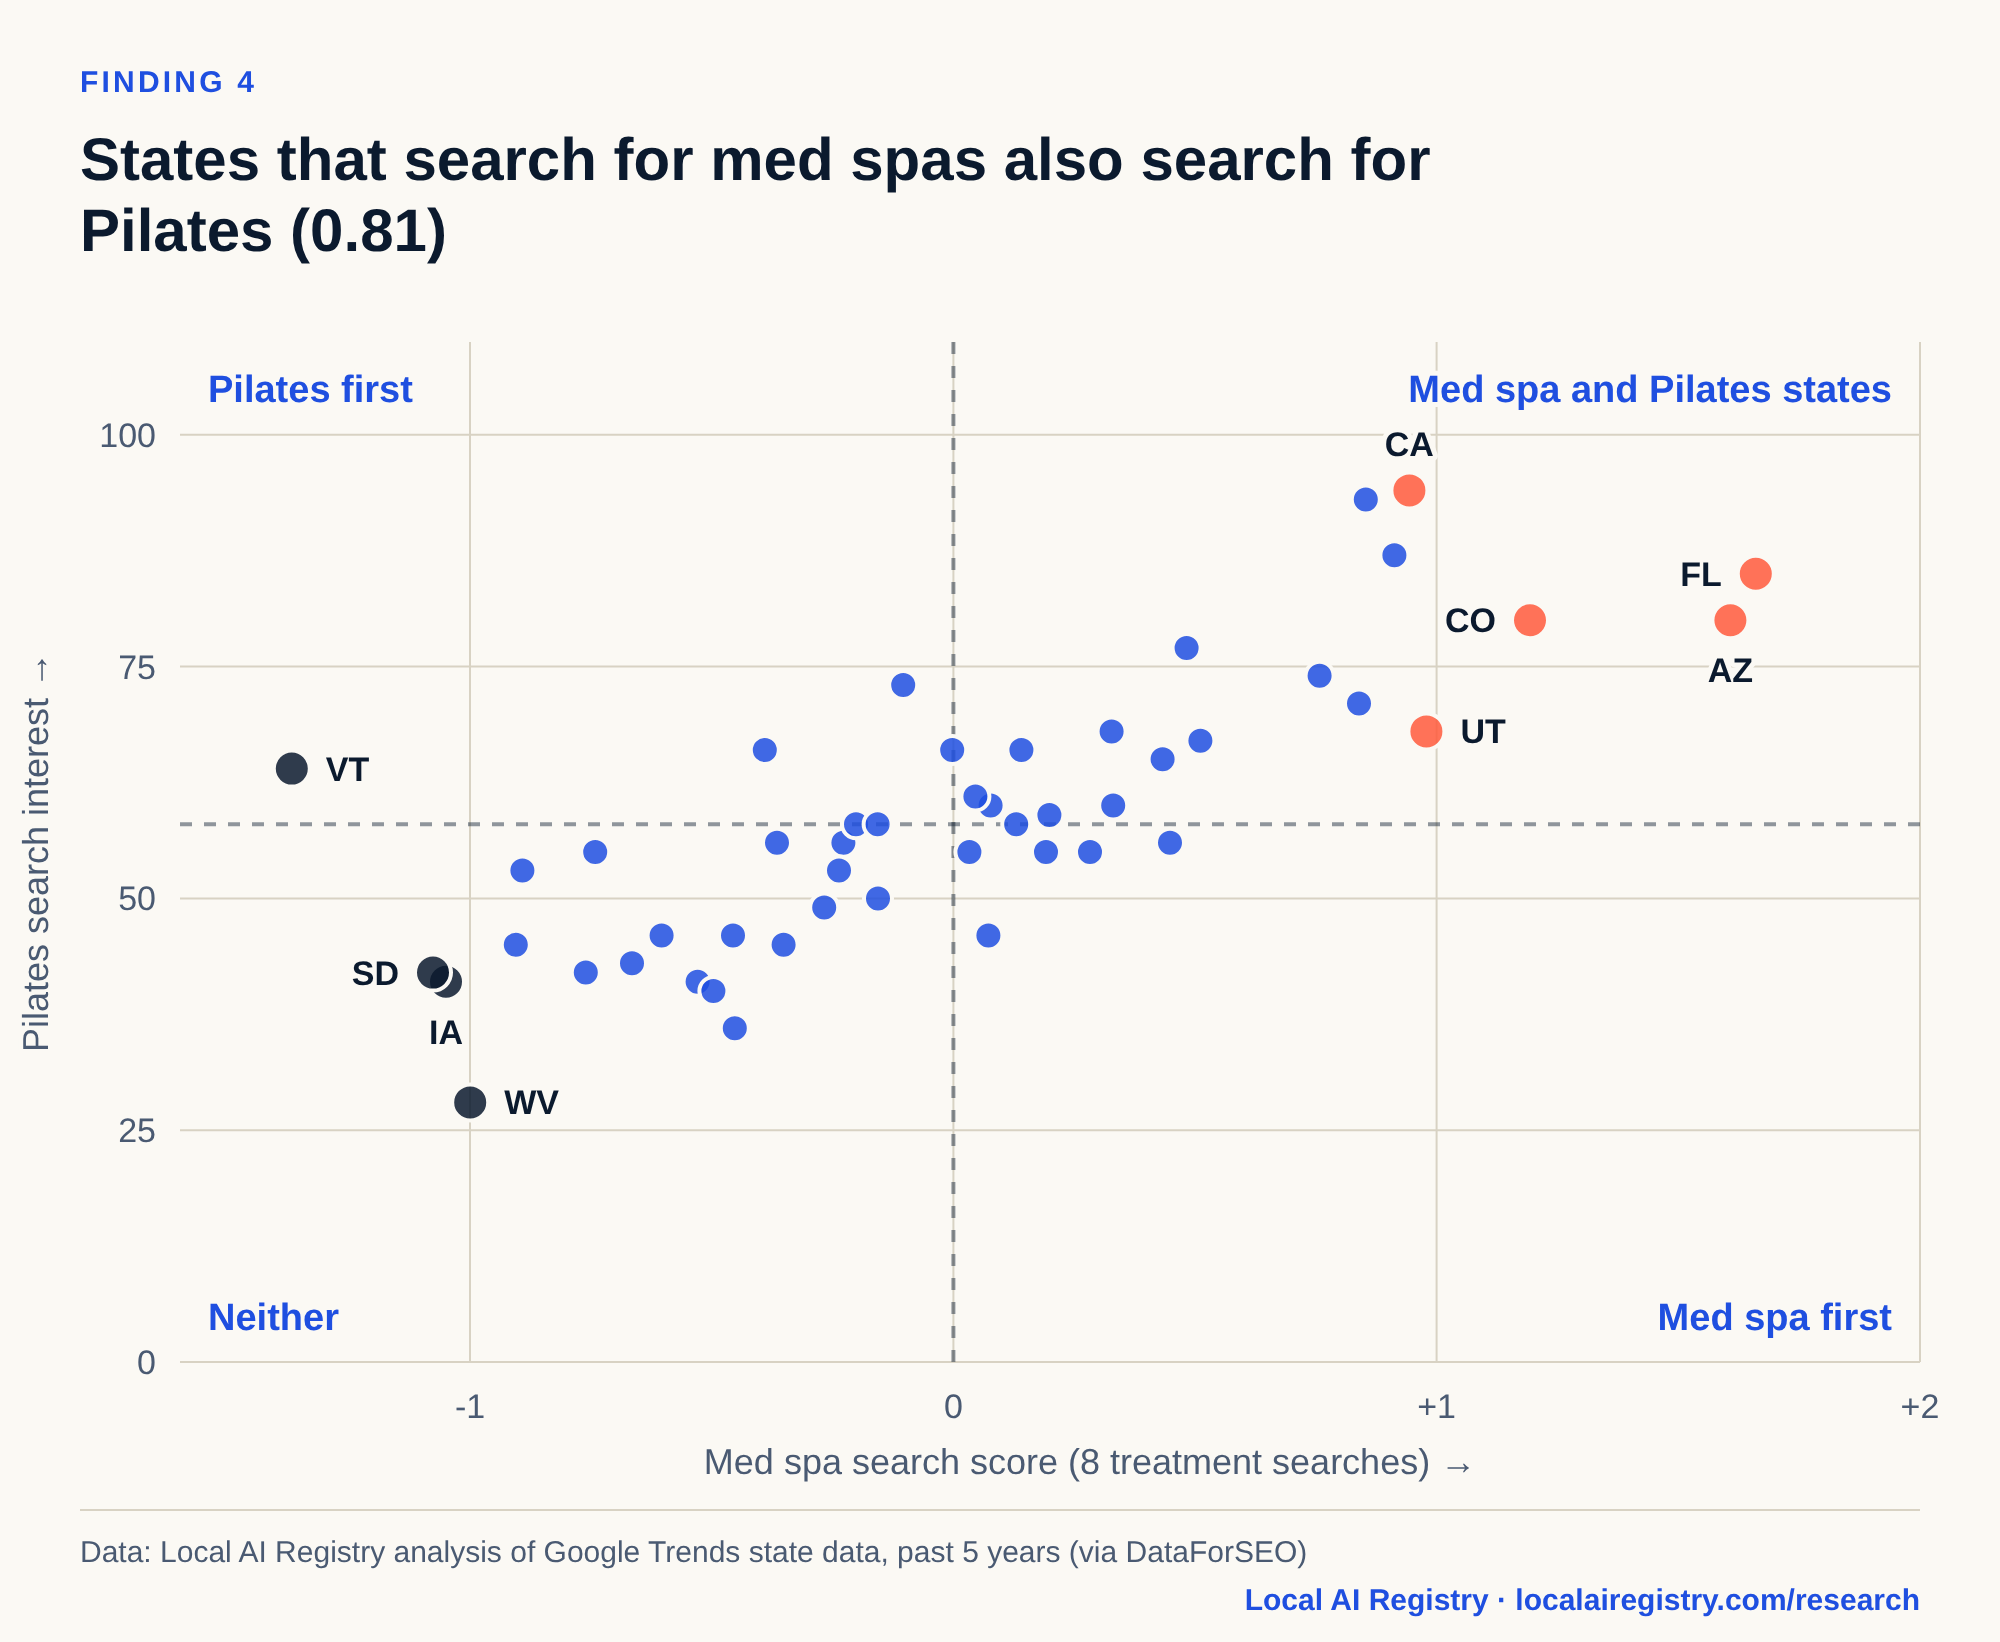
Data behind this chart
| State | Med spa search score | Pilates search interest |
|---|---|---|
| FL | 1.66 | 85 |
| AZ | 1.61 | 80 |
| CO | 1.19 | 80 |
| UT | 0.98 | 68 |
| CA | 0.94 | 94 |
| NJ | 0.91 | 87 |
| NY | 0.85 | 93 |
| TX | 0.84 | 71 |
| MA | 0.76 | 74 |
| IL | 0.51 | 67 |
| NV | 0.48 | 77 |
| TN | 0.45 | 56 |
| GA | 0.43 | 65 |
| NH | 0.33 | 60 |
| RI | 0.33 | 68 |
| ID | 0.28 | 55 |
| WA | 0.2 | 59 |
| LA | 0.19 | 55 |
| HI | 0.14 | 66 |
| SC | 0.13 | 58 |
| NC | 0.08 | 60 |
| KY | 0.07 | 46 |
| VA | 0.05 | 61 |
| KS | 0.03 | 55 |
| MD | -0.0 | 66 |
| CT | -0.1 | 73 |
| NM | -0.16 | 50 |
| MN | -0.16 | 58 |
| MI | -0.2 | 58 |
| PA | -0.23 | 56 |
| OH | -0.24 | 53 |
| MO | -0.27 | 49 |
| NE | -0.35 | 45 |
| OR | -0.36 | 56 |
| DE | -0.39 | 66 |
| ND | -0.45 | 36 |
| AL | -0.46 | 46 |
| OK | -0.5 | 40 |
| AR | -0.53 | 41 |
| WI | -0.6 | 46 |
| MS | -0.66 | 43 |
| MT | -0.74 | 55 |
| IN | -0.76 | 42 |
| ME | -0.89 | 53 |
| AK | -0.91 | 45 |
| WV | -1.0 | 28 |
| IA | -1.05 | 41 |
| SD | -1.08 | 42 |
| VT | -1.37 | 64 |
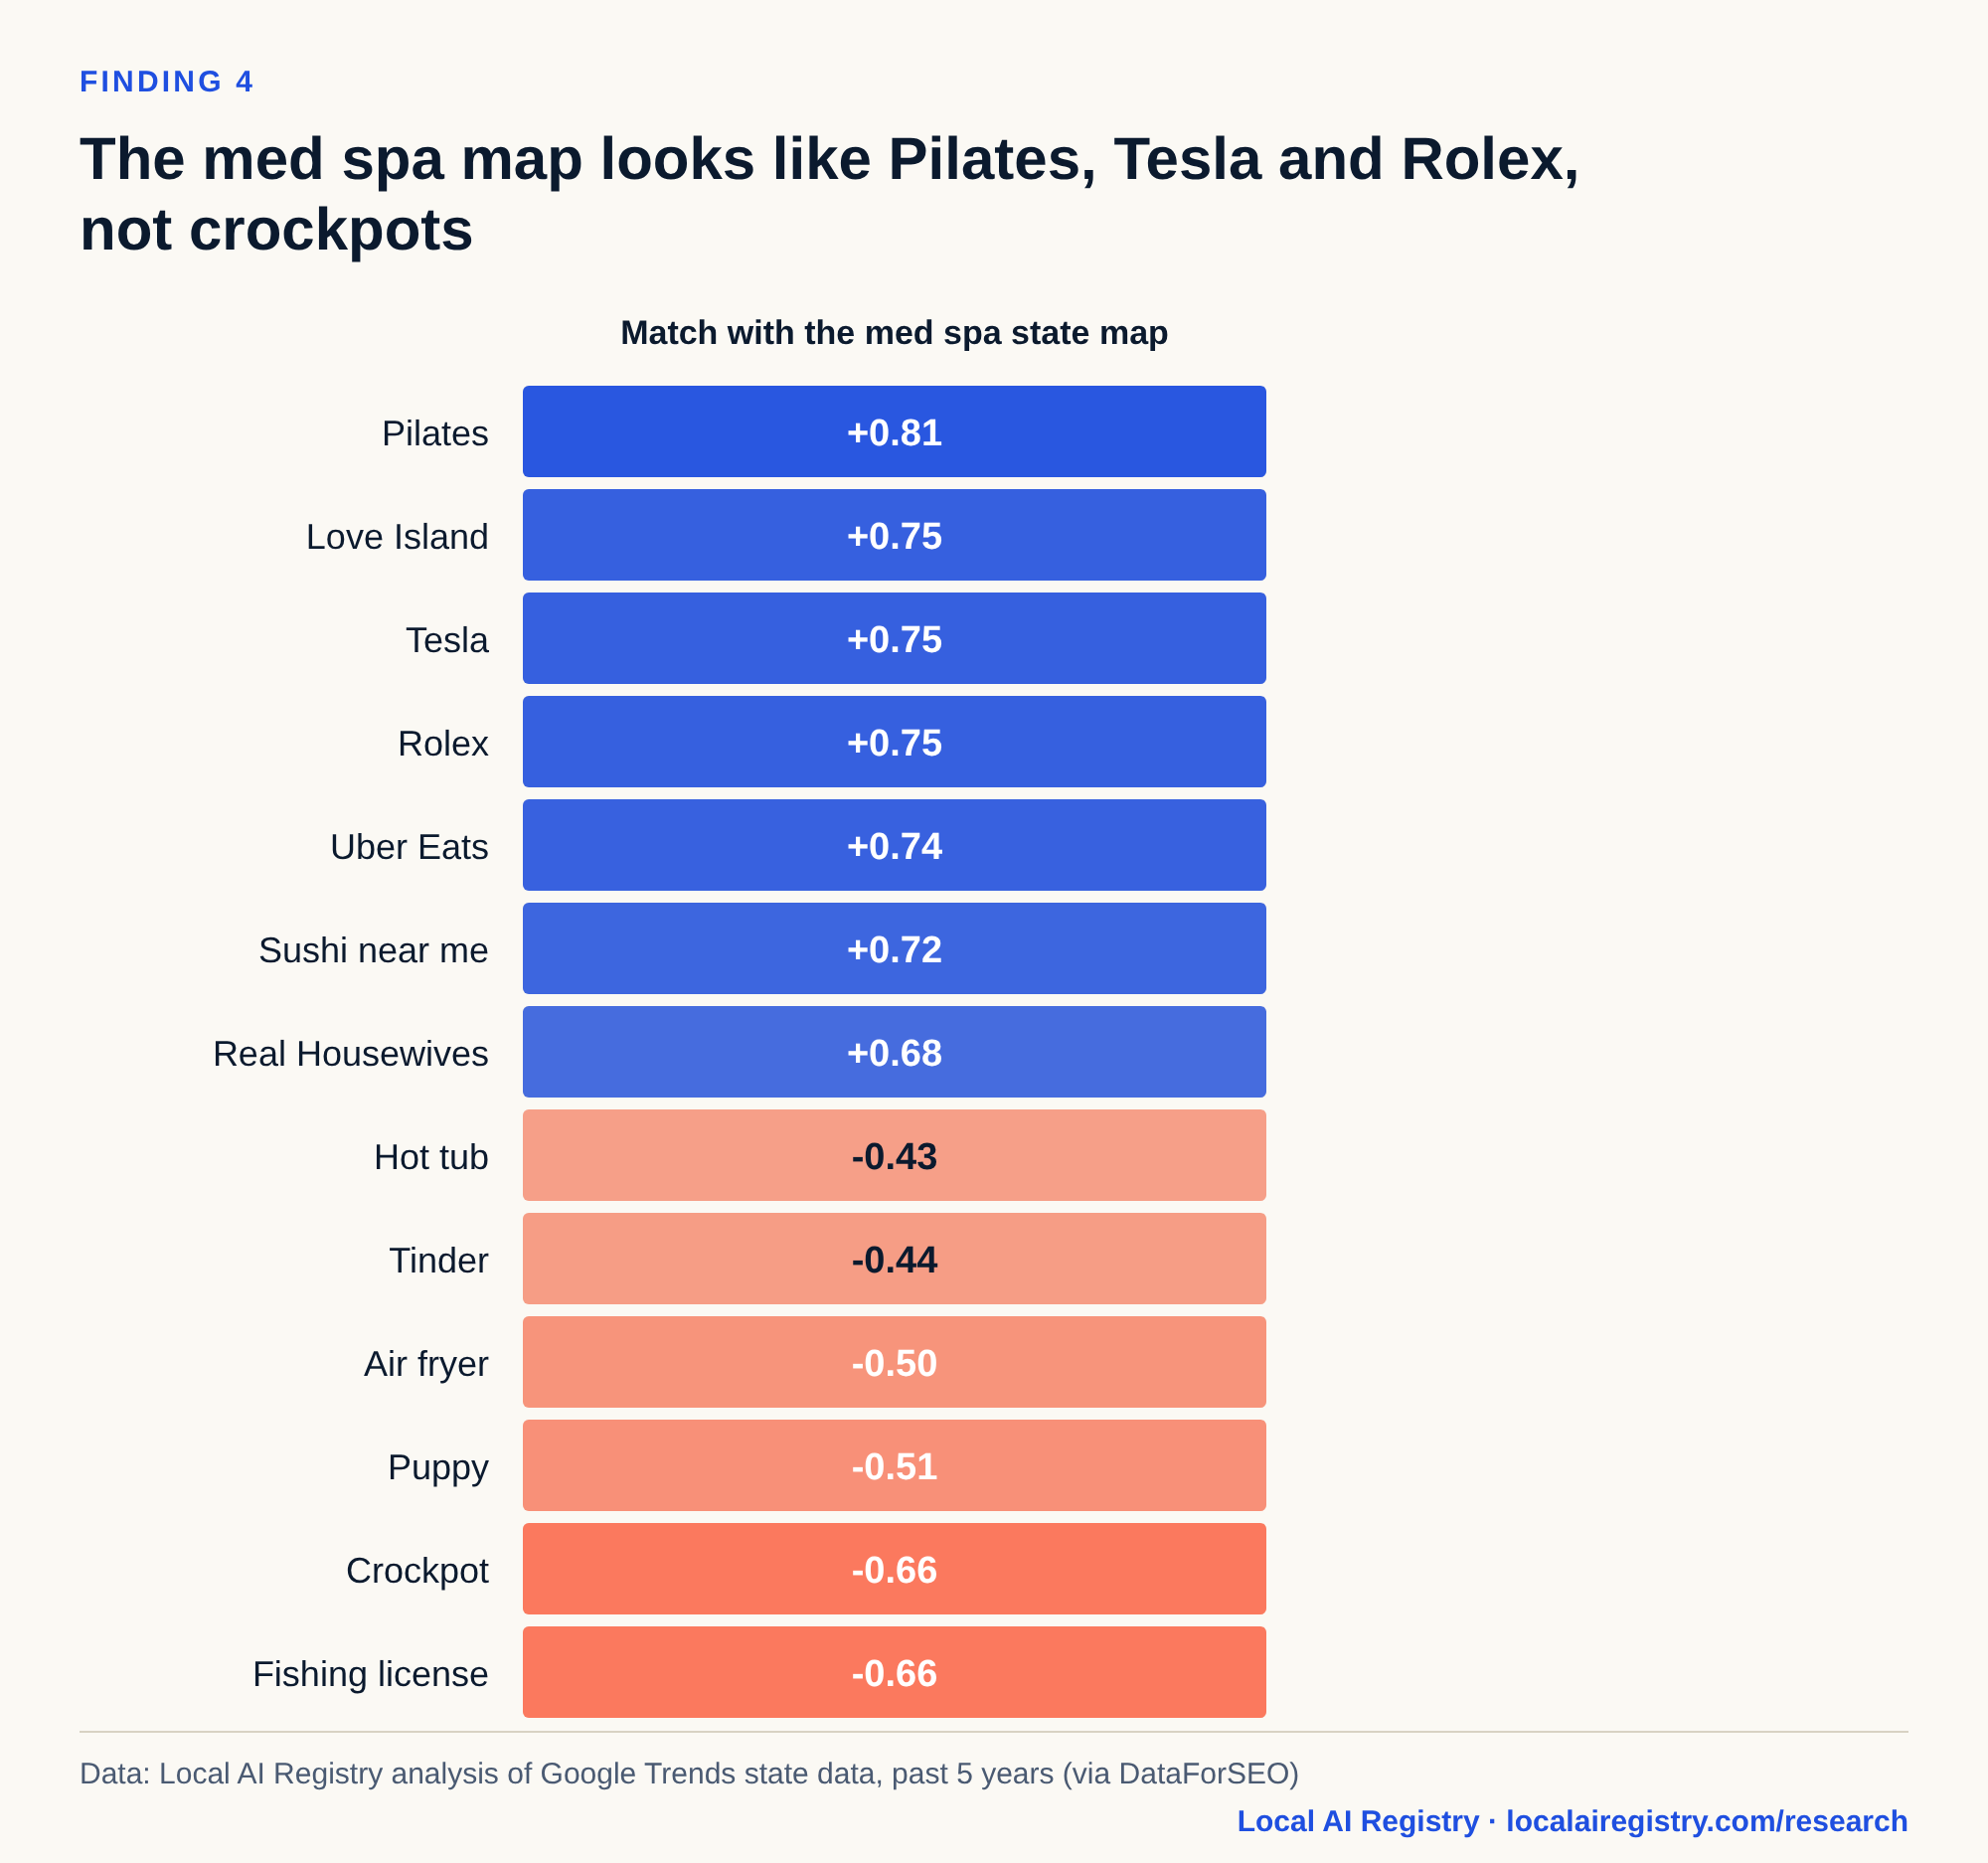
Data behind this chart
| Search | State rank match with med spa score |
|---|---|
| Pilates | 0.81 |
| Love Island | 0.75 |
| Tesla | 0.75 |
| Rolex | 0.75 |
| Uber Eats | 0.74 |
| Sushi near me | 0.72 |
| Real Housewives | 0.68 |
| Hot tub | -0.43 |
| Tinder | -0.44 |
| Air fryer | -0.5 |
| Puppy | -0.51 |
| Crockpot | -0.66 |
| Fishing license | -0.66 |
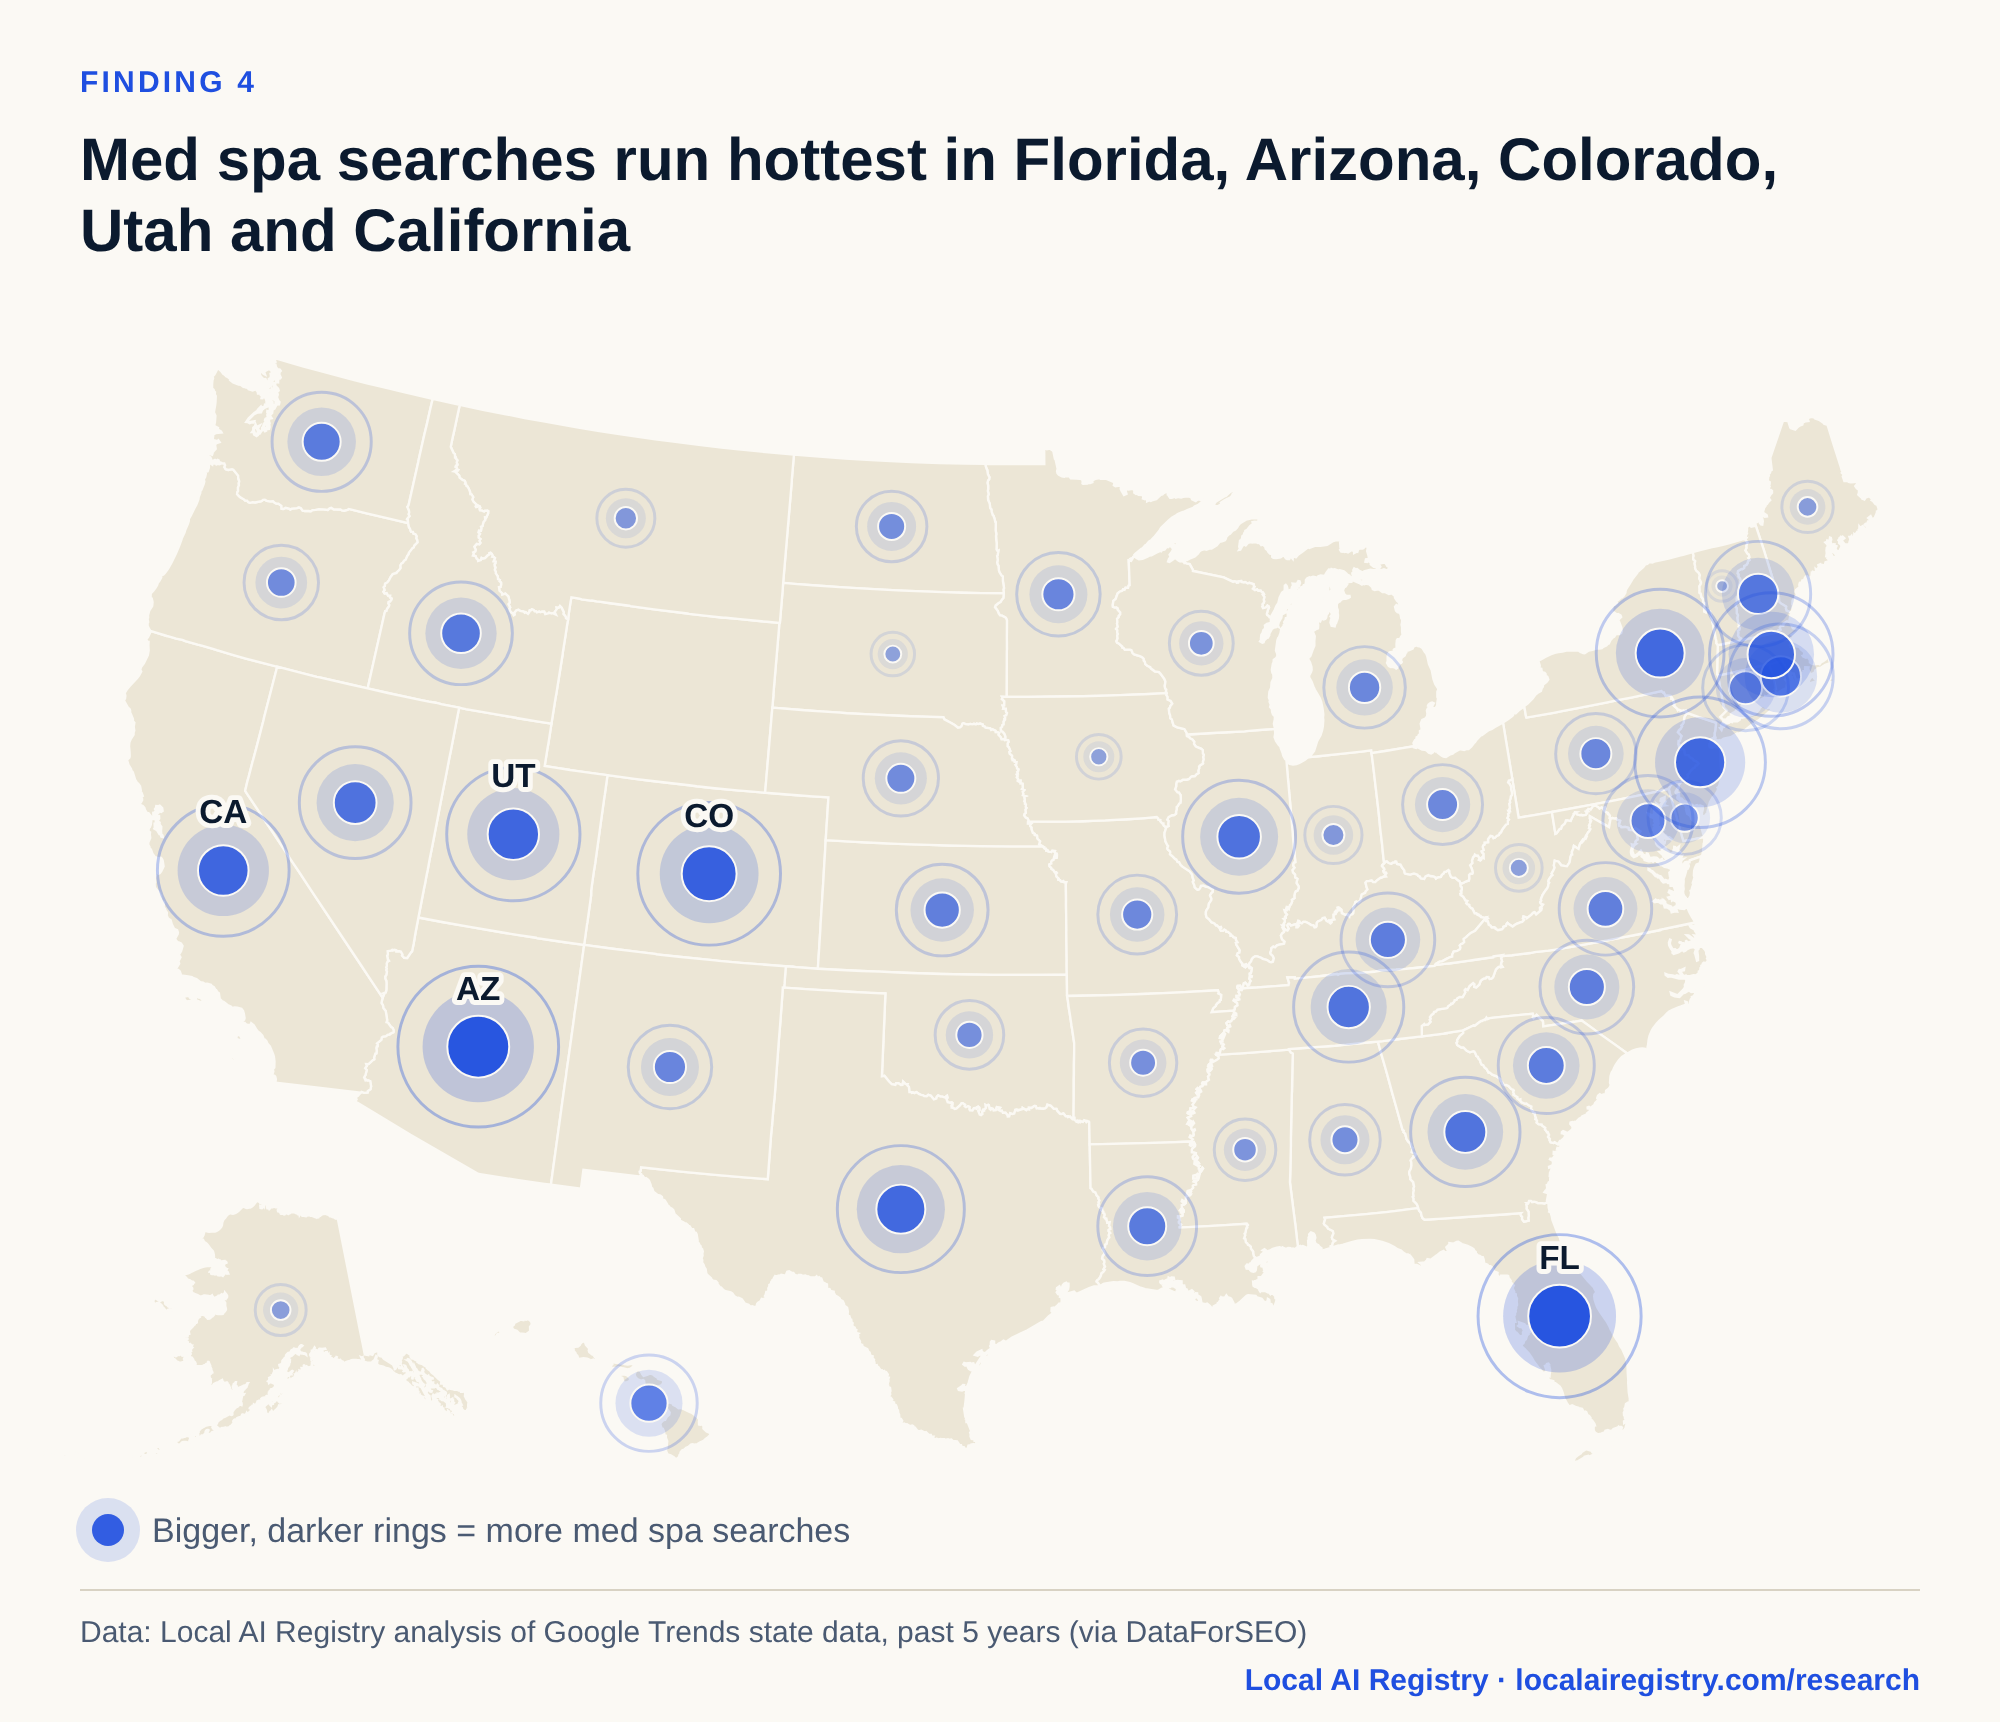
Data behind this chart
| State | Med spa search score |
|---|---|
| FL | 1.66 |
| AZ | 1.61 |
| CO | 1.19 |
| UT | 0.98 |
| CA | 0.94 |
| NJ | 0.91 |
| NY | 0.85 |
| TX | 0.84 |
| MA | 0.76 |
| IL | 0.51 |
| NV | 0.48 |
| TN | 0.45 |
| GA | 0.43 |
| NH | 0.33 |
| RI | 0.33 |
| ID | 0.28 |
| WA | 0.2 |
| LA | 0.19 |
| HI | 0.14 |
| SC | 0.13 |
| NC | 0.08 |
| KY | 0.07 |
| VA | 0.05 |
| KS | 0.03 |
| MD | -0.0 |
| CT | -0.1 |
| NM | -0.16 |
| MN | -0.16 |
| MI | -0.2 |
| PA | -0.23 |
| OH | -0.24 |
| MO | -0.27 |
| NE | -0.35 |
| OR | -0.36 |
| DE | -0.39 |
| ND | -0.45 |
| AL | -0.46 |
| OK | -0.5 |
| AR | -0.53 |
| WI | -0.6 |
| MS | -0.66 |
| MT | -0.74 |
| IN | -0.76 |
| ME | -0.89 |
| AK | -0.91 |
| WV | -1.0 |
| IA | -1.05 |
| SD | -1.08 |
| VT | -1.37 |
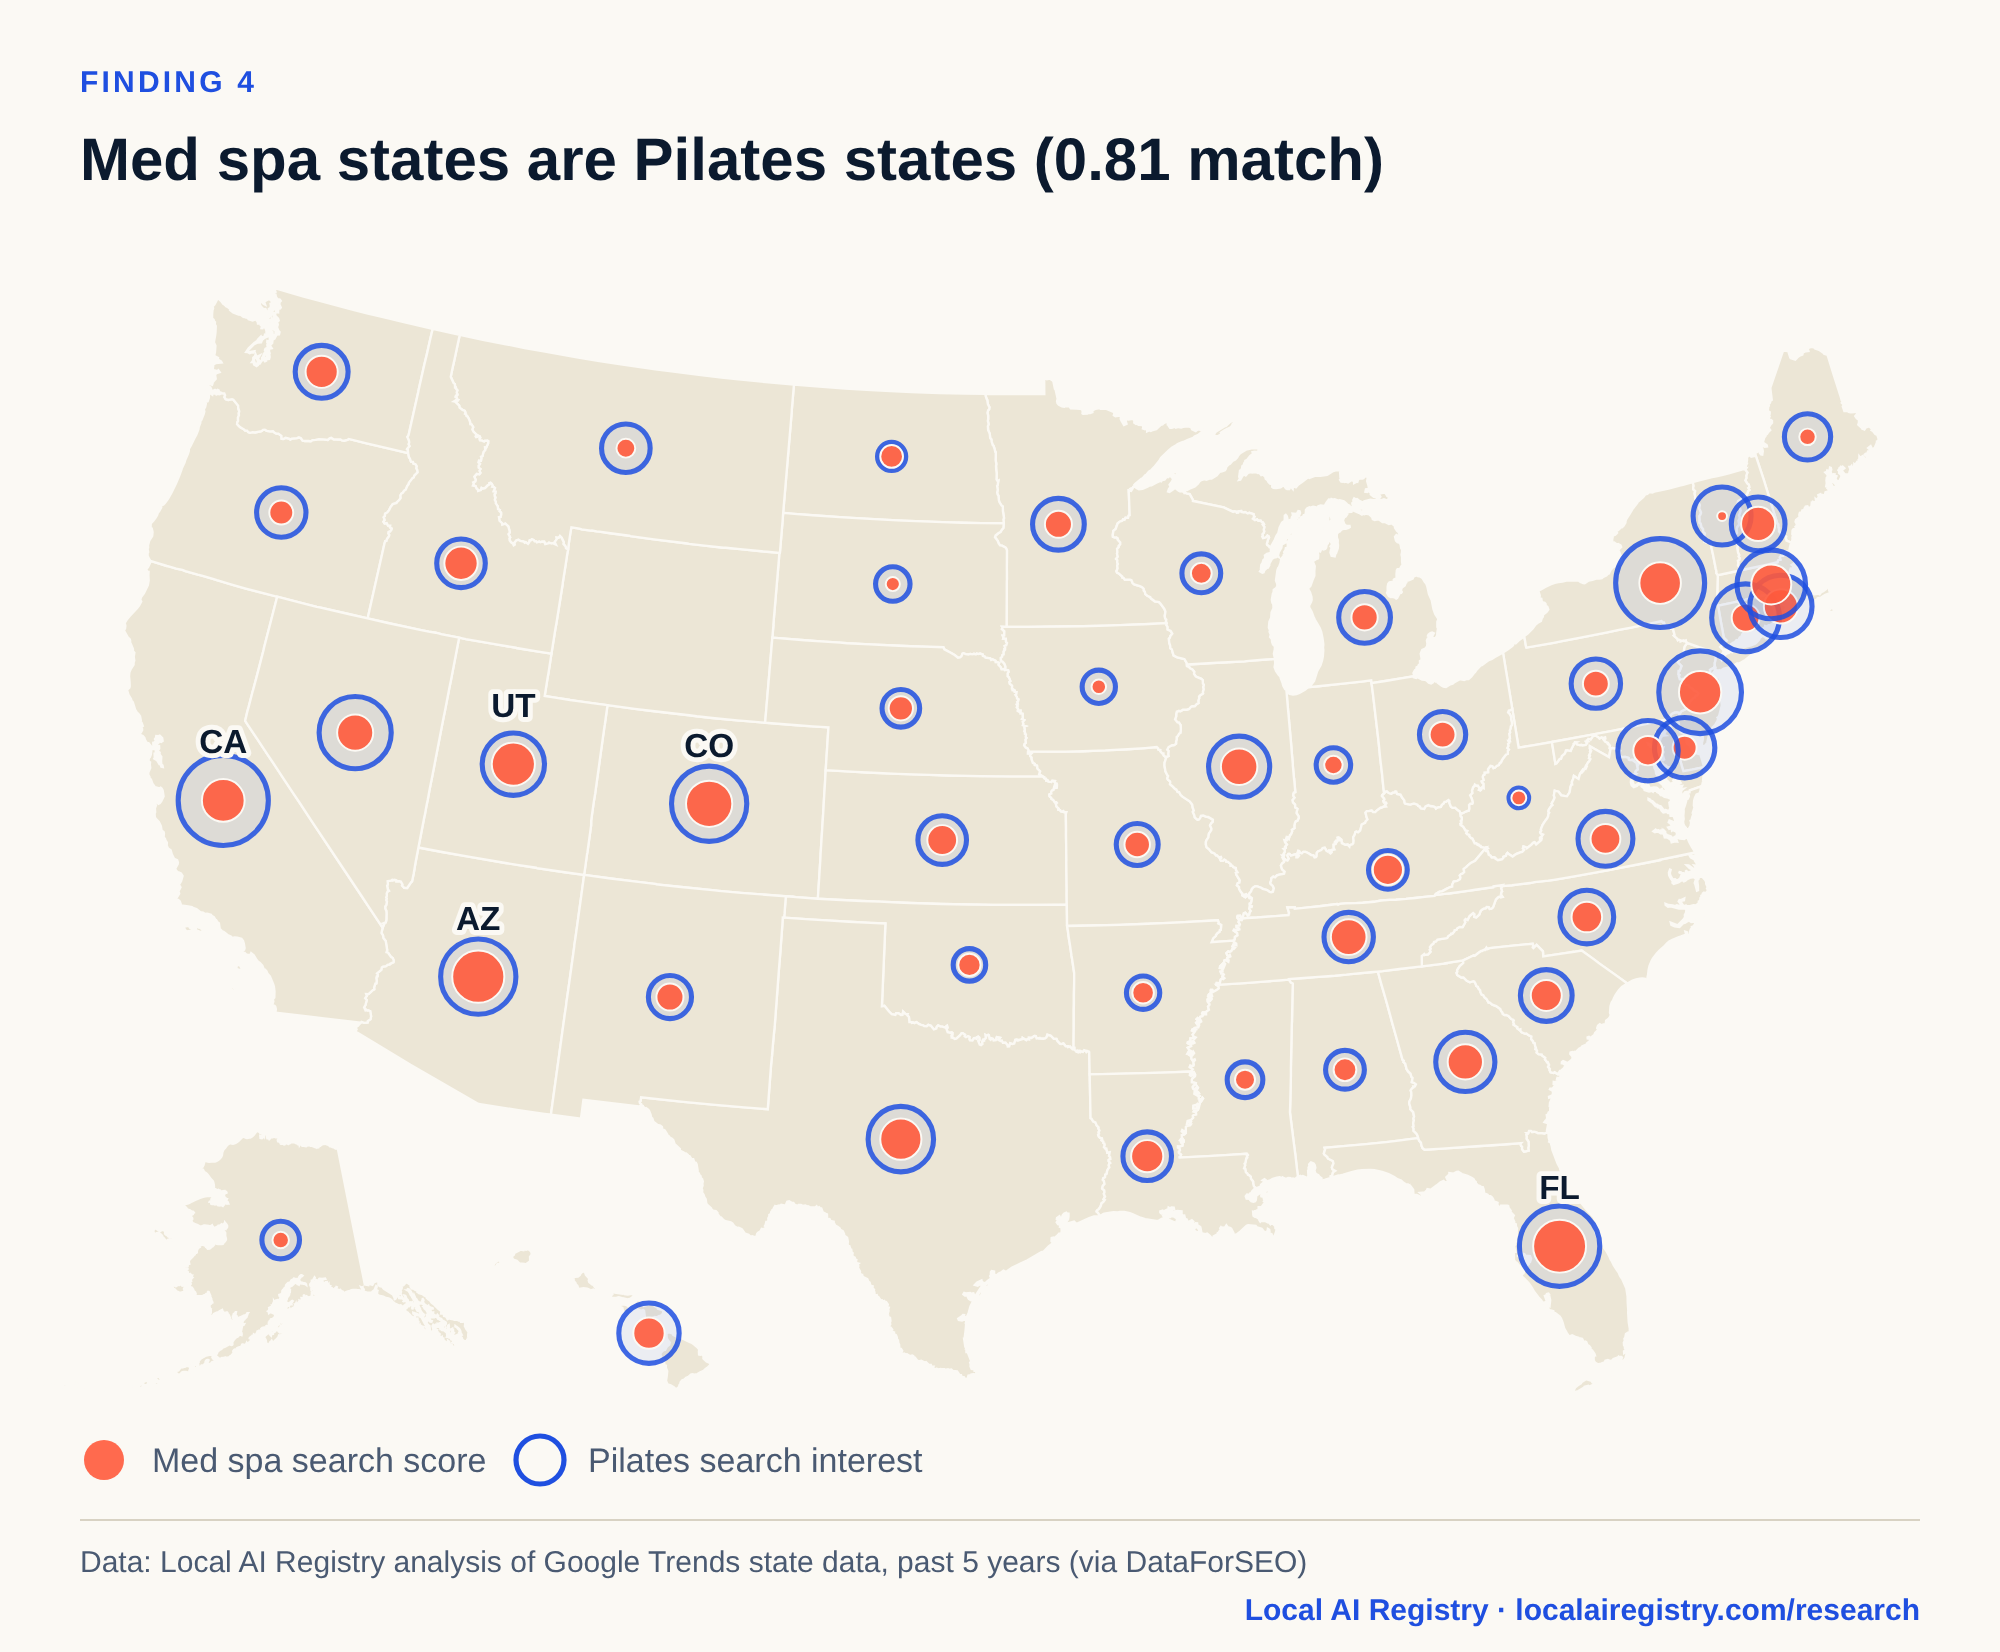
Data behind this chart
| State | Med spa search score | Pilates search interest |
|---|---|---|
| FL | 1.66 | 85 |
| AZ | 1.61 | 80 |
| CO | 1.19 | 80 |
| UT | 0.98 | 68 |
| CA | 0.94 | 94 |
| NJ | 0.91 | 87 |
| NY | 0.85 | 93 |
| TX | 0.84 | 71 |
| MA | 0.76 | 74 |
| IL | 0.51 | 67 |
| NV | 0.48 | 77 |
| TN | 0.45 | 56 |
| GA | 0.43 | 65 |
| NH | 0.33 | 60 |
| RI | 0.33 | 68 |
| ID | 0.28 | 55 |
| WA | 0.2 | 59 |
| LA | 0.19 | 55 |
| HI | 0.14 | 66 |
| SC | 0.13 | 58 |
| NC | 0.08 | 60 |
| KY | 0.07 | 46 |
| VA | 0.05 | 61 |
| KS | 0.03 | 55 |
| MD | -0.0 | 66 |
| CT | -0.1 | 73 |
| NM | -0.16 | 50 |
| MN | -0.16 | 58 |
| MI | -0.2 | 58 |
| PA | -0.23 | 56 |
| OH | -0.24 | 53 |
| MO | -0.27 | 49 |
| NE | -0.35 | 45 |
| OR | -0.36 | 56 |
| DE | -0.39 | 66 |
| ND | -0.45 | 36 |
| AL | -0.46 | 46 |
| OK | -0.5 | 40 |
| AR | -0.53 | 41 |
| WI | -0.6 | 46 |
| MS | -0.66 | 43 |
| MT | -0.74 | 55 |
| IN | -0.76 | 42 |
| ME | -0.89 | 53 |
| AK | -0.91 | 45 |
| WV | -1.0 | 28 |
| IA | -1.05 | 41 |
| SD | -1.08 | 42 |
| VT | -1.37 | 64 |
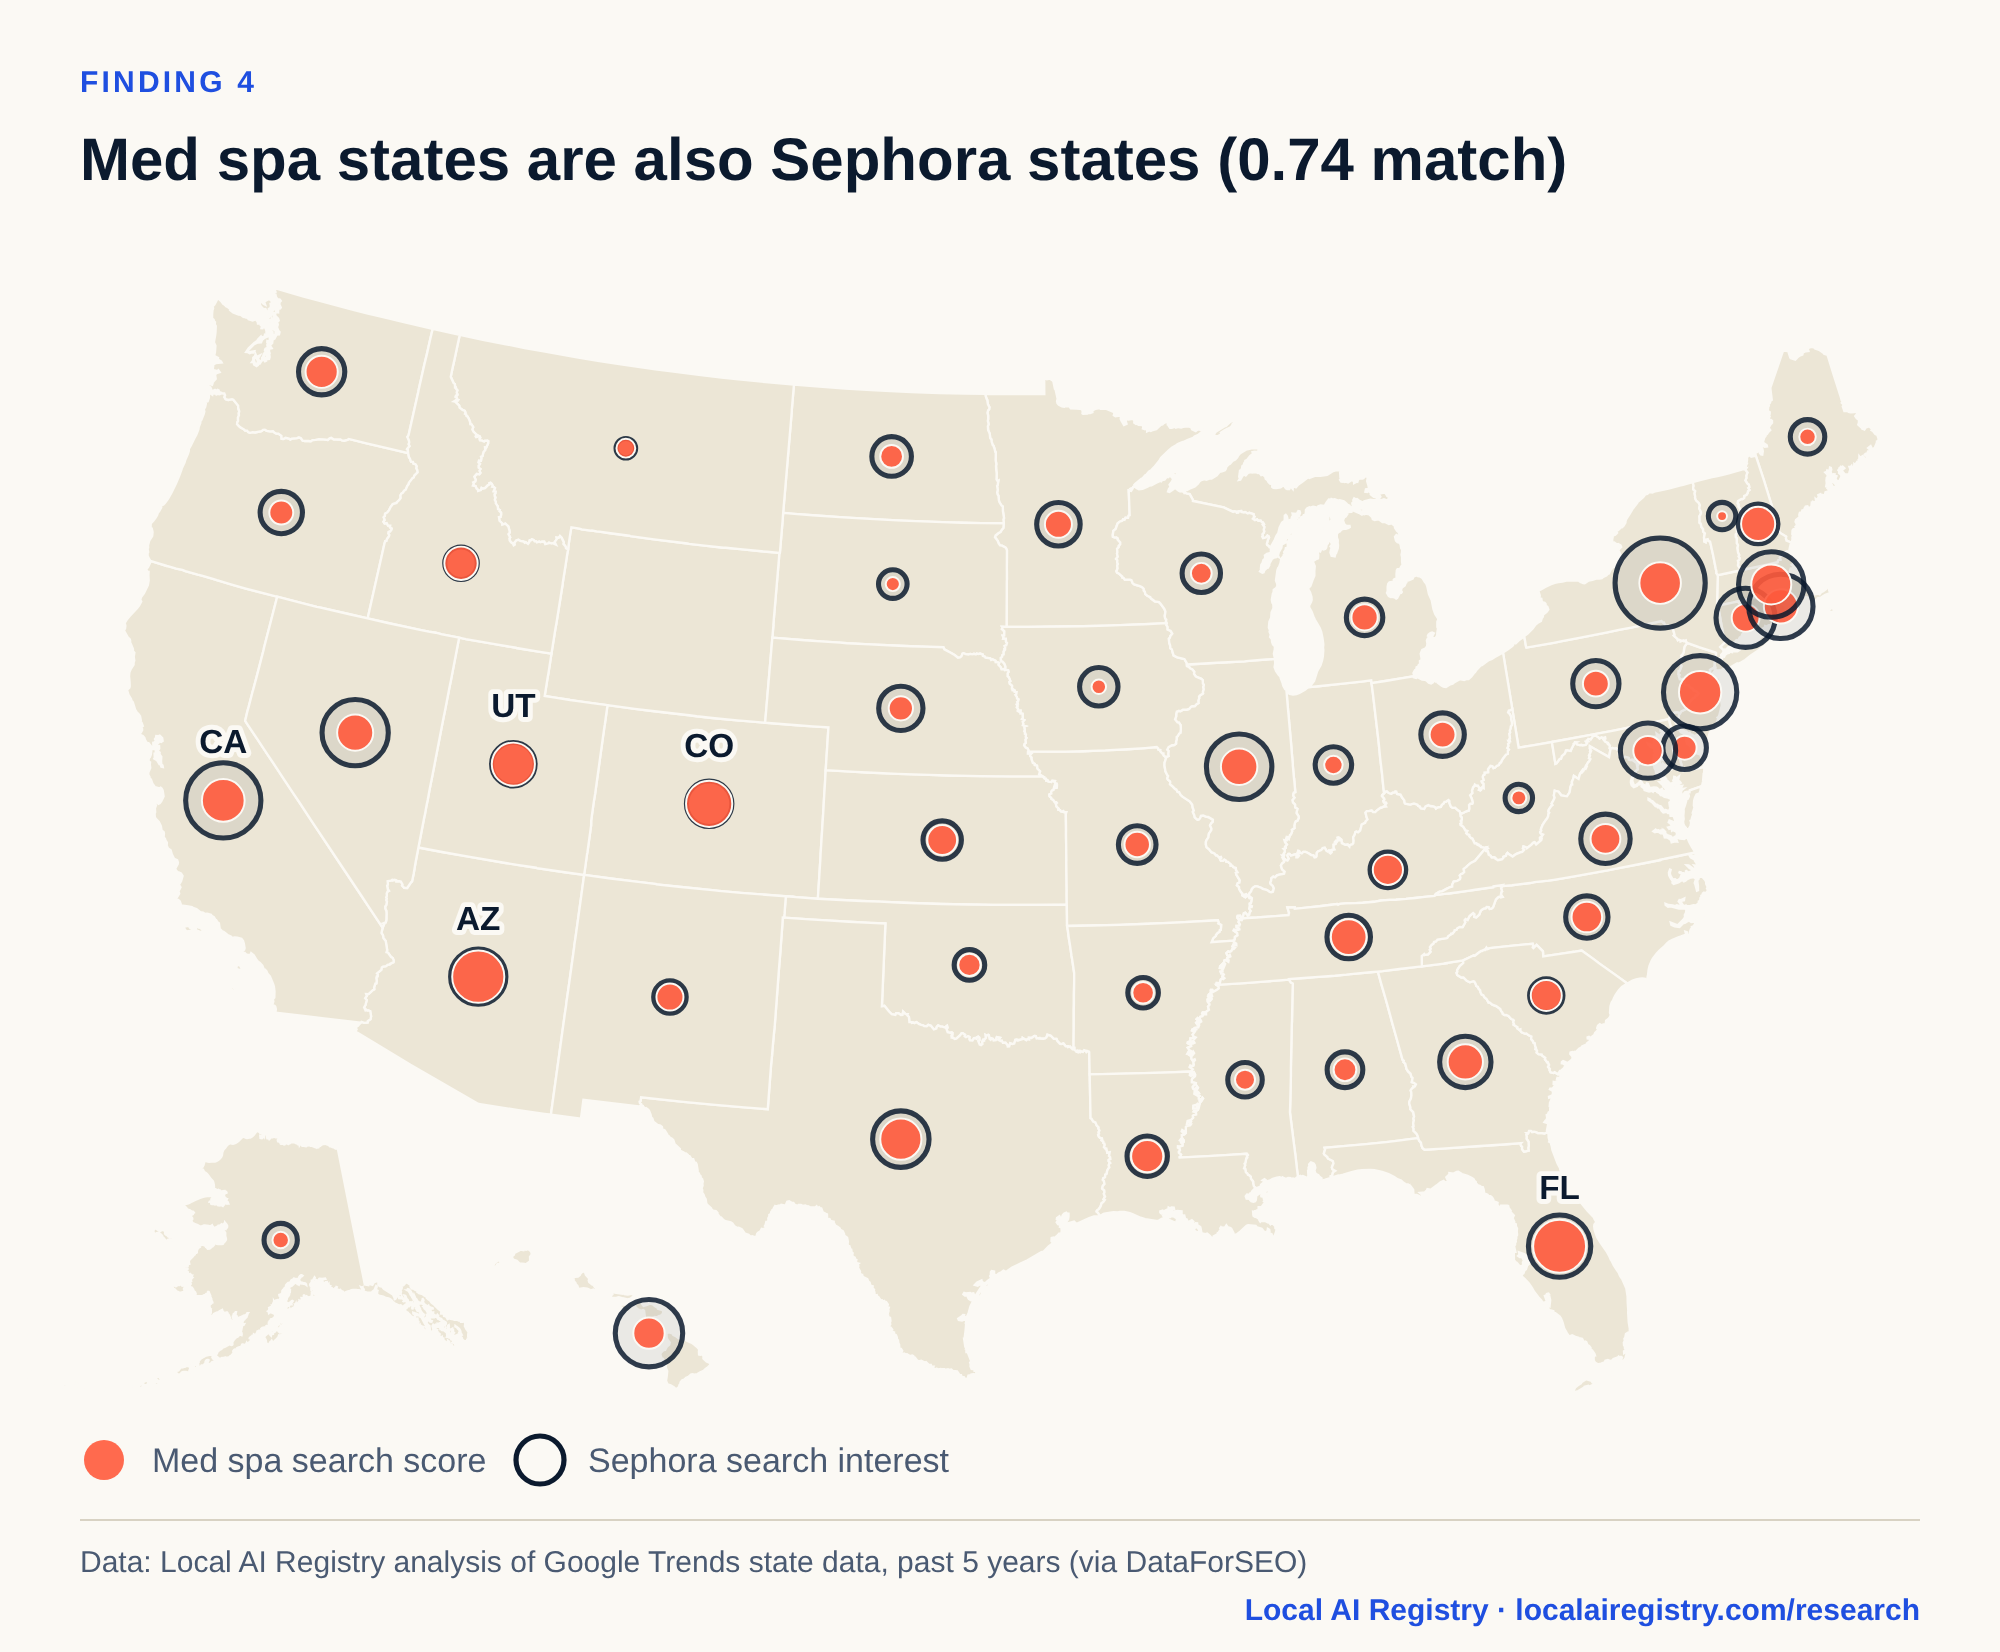
Data behind this chart
| State | Med spa search score | Sephora search interest |
|---|---|---|
| FL | 1.66 | 72 |
| AZ | 1.61 | 65 |
| CO | 1.19 | 55 |
| UT | 0.98 | 53 |
| CA | 0.94 | 85 |
| NJ | 0.91 | 83 |
| NY | 0.85 | 100 |
| TX | 0.84 | 66 |
| MA | 0.76 | 75 |
| IL | 0.51 | 75 |
| NV | 0.48 | 76 |
| TN | 0.45 | 53 |
| GA | 0.43 | 61 |
| NH | 0.33 | 49 |
| RI | 0.33 | 74 |
| ID | 0.28 | 42 |
| WA | 0.2 | 56 |
| LA | 0.19 | 50 |
| HI | 0.14 | 77 |
| SC | 0.13 | 43 |
| NC | 0.08 | 52 |
| KY | 0.07 | 45 |
| VA | 0.05 | 59 |
| KS | 0.03 | 48 |
| MD | -0.0 | 65 |
| CT | -0.1 | 69 |
| NM | -0.16 | 42 |
| MN | -0.16 | 53 |
| MI | -0.2 | 46 |
| PA | -0.23 | 56 |
| OH | -0.24 | 53 |
| MO | -0.27 | 47 |
| NE | -0.35 | 54 |
| OR | -0.36 | 52 |
| DE | -0.39 | 53 |
| ND | -0.45 | 49 |
| AL | -0.46 | 45 |
| OK | -0.5 | 40 |
| AR | -0.53 | 40 |
| WI | -0.6 | 48 |
| MS | -0.66 | 44 |
| MT | -0.74 | 29 |
| IN | -0.76 | 46 |
| ME | -0.89 | 44 |
| AK | -0.91 | 43 |
| WV | -1.0 | 37 |
| IA | -1.05 | 48 |
| SD | -1.08 | 38 |
| VT | -1.37 | 37 |
Data behind this chart
| State | Med spa search score | Equinox search interest |
|---|---|---|
| FL | 1.66 | 42 |
| AZ | 1.61 | 42 |
| CO | 1.19 | 41 |
| UT | 0.98 | 35 |
| CA | 0.94 | 50 |
| NJ | 0.91 | 43 |
| NY | 0.85 | 79 |
| TX | 0.84 | 45 |
| MA | 0.76 | 51 |
| IL | 0.51 | 63 |
| NV | 0.48 | 37 |
| TN | 0.45 | 44 |
| GA | 0.43 | 39 |
| NH | 0.33 | 47 |
| RI | 0.33 | 39 |
| ID | 0.28 | 42 |
| WA | 0.2 | 42 |
| LA | 0.19 | 37 |
| HI | 0.14 | 23 |
| SC | 0.13 | 42 |
| NC | 0.08 | 44 |
| KY | 0.07 | 69 |
| VA | 0.05 | 39 |
| KS | 0.03 | 56 |
| MD | -0.0 | 41 |
| CT | -0.1 | 50 |
| NM | -0.16 | 40 |
| MN | -0.16 | 64 |
| MI | -0.2 | 100 |
| PA | -0.23 | 49 |
| OH | -0.24 | 64 |
| MO | -0.27 | 62 |
| NE | -0.35 | 63 |
| OR | -0.36 | 42 |
| DE | -0.39 | 54 |
| ND | -0.45 | 67 |
| AL | -0.46 | 41 |
| OK | -0.5 | 51 |
| AR | -0.53 | 50 |
| WI | -0.6 | 73 |
| MS | -0.66 | 50 |
| MT | -0.74 | 52 |
| IN | -0.76 | 74 |
| ME | -0.89 | 50 |
| AK | -0.91 | 61 |
| WV | -1.0 | 70 |
| IA | -1.05 | 78 |
| SD | -1.08 | 74 |
| VT | -1.37 | 91 |
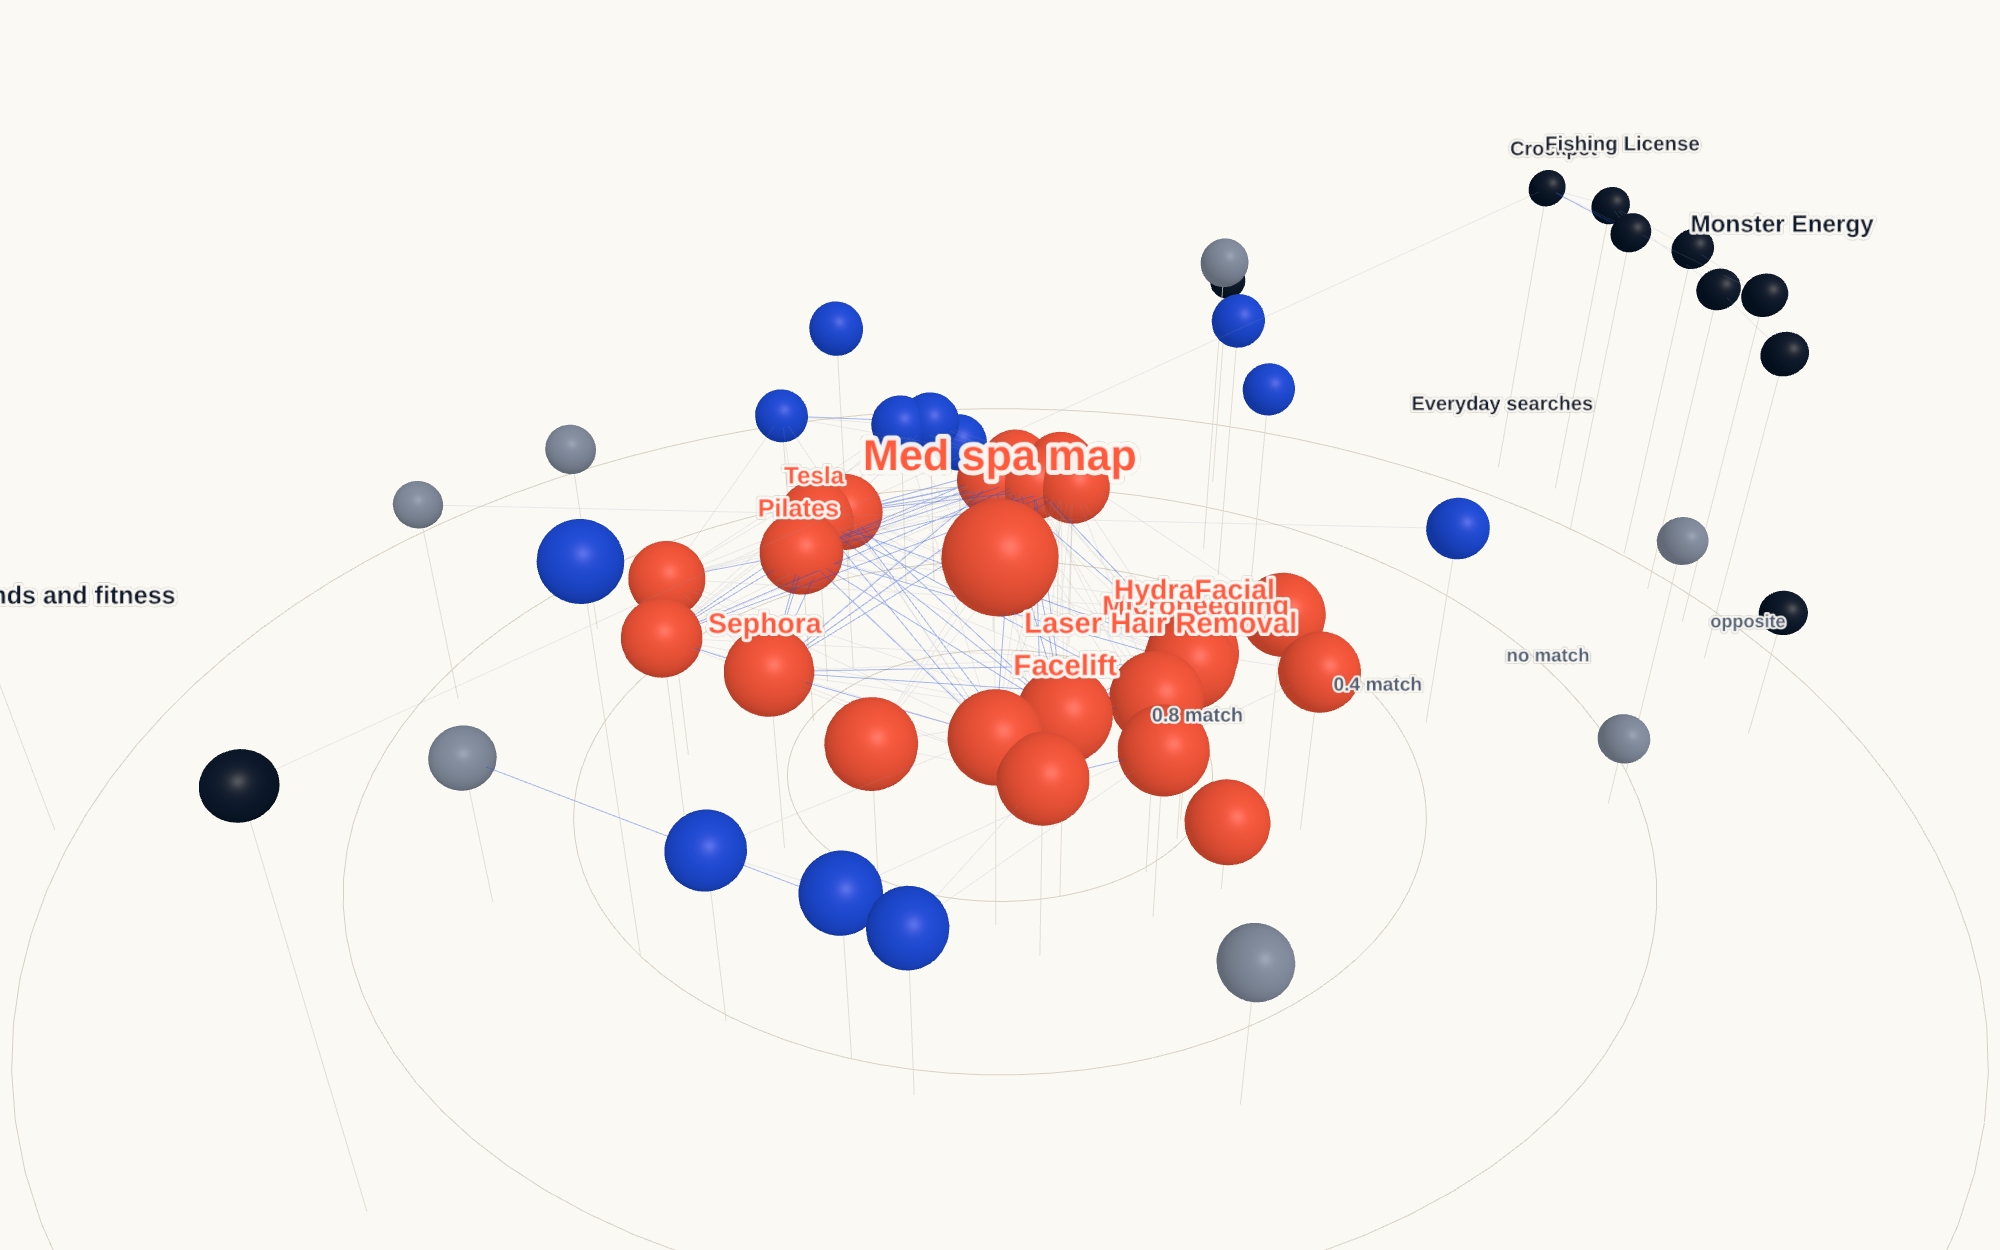
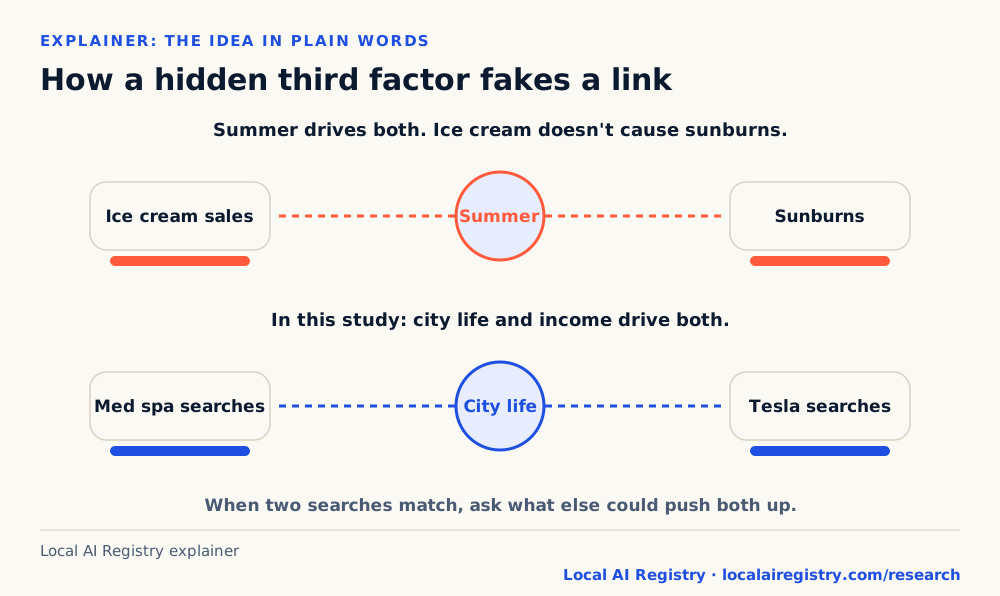
Florida, Arizona, Colorado, Utah and California lead the med spa score; Vermont, South Dakota, Iowa and West Virginia trail. The everyday searches that share the map (Pilates, Tesla, Rolex, Uber Eats, sushi) and the ones that oppose it (crockpots, fishing licenses, air fryers) suggest much of this is the map of city life and income. Treat it as a wallet signal, not a cause.
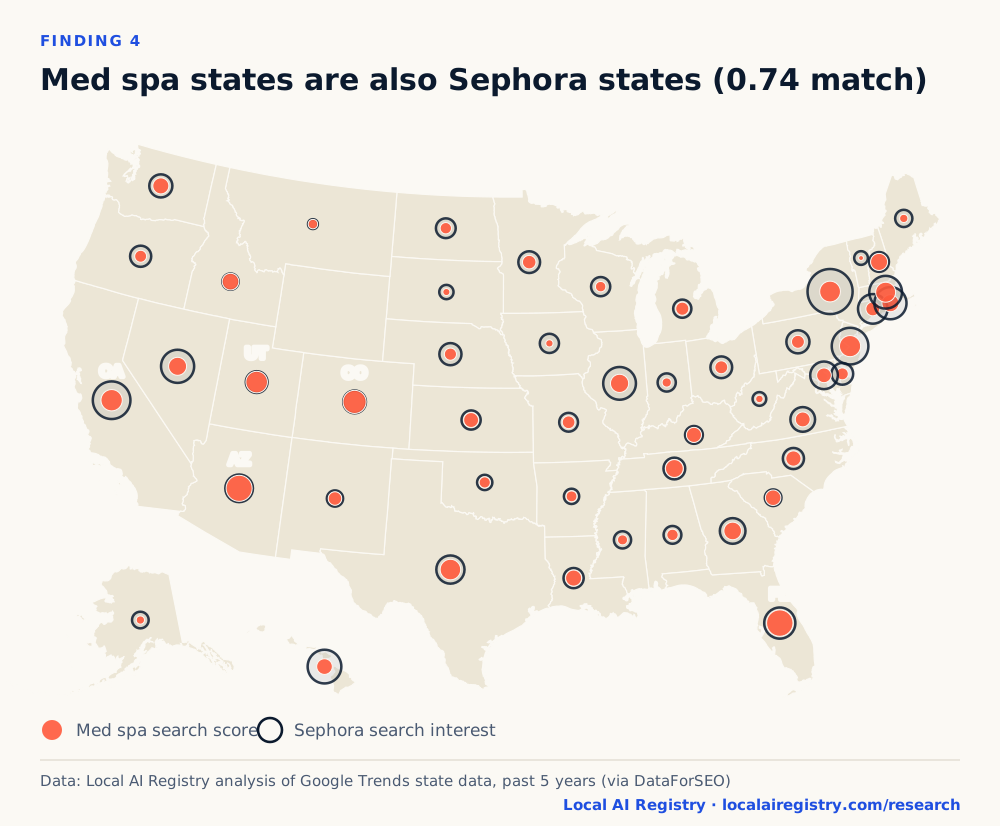
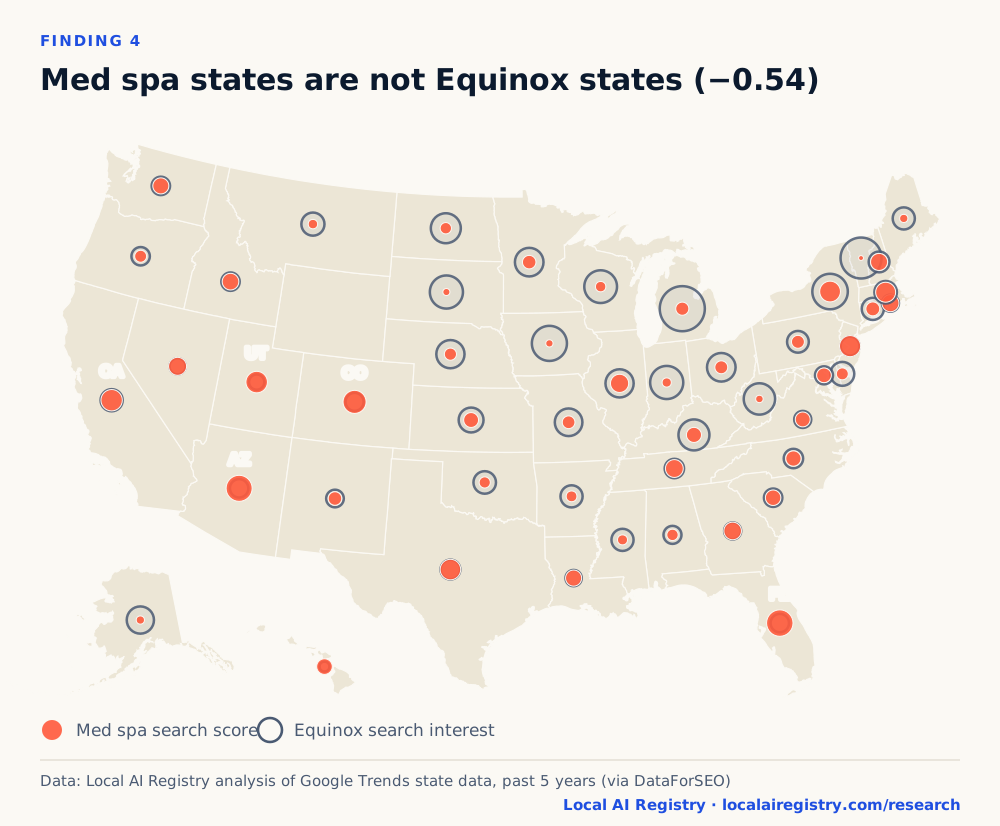
The ring maps put two searches on one map. Med spa states are Pilates states (0.81) and Sephora states (0.74), but not Equinox states (−0.54). So Sephora passes on place as well as on time, and Equinox fails on both.
Who searches for aesthetic treatments?
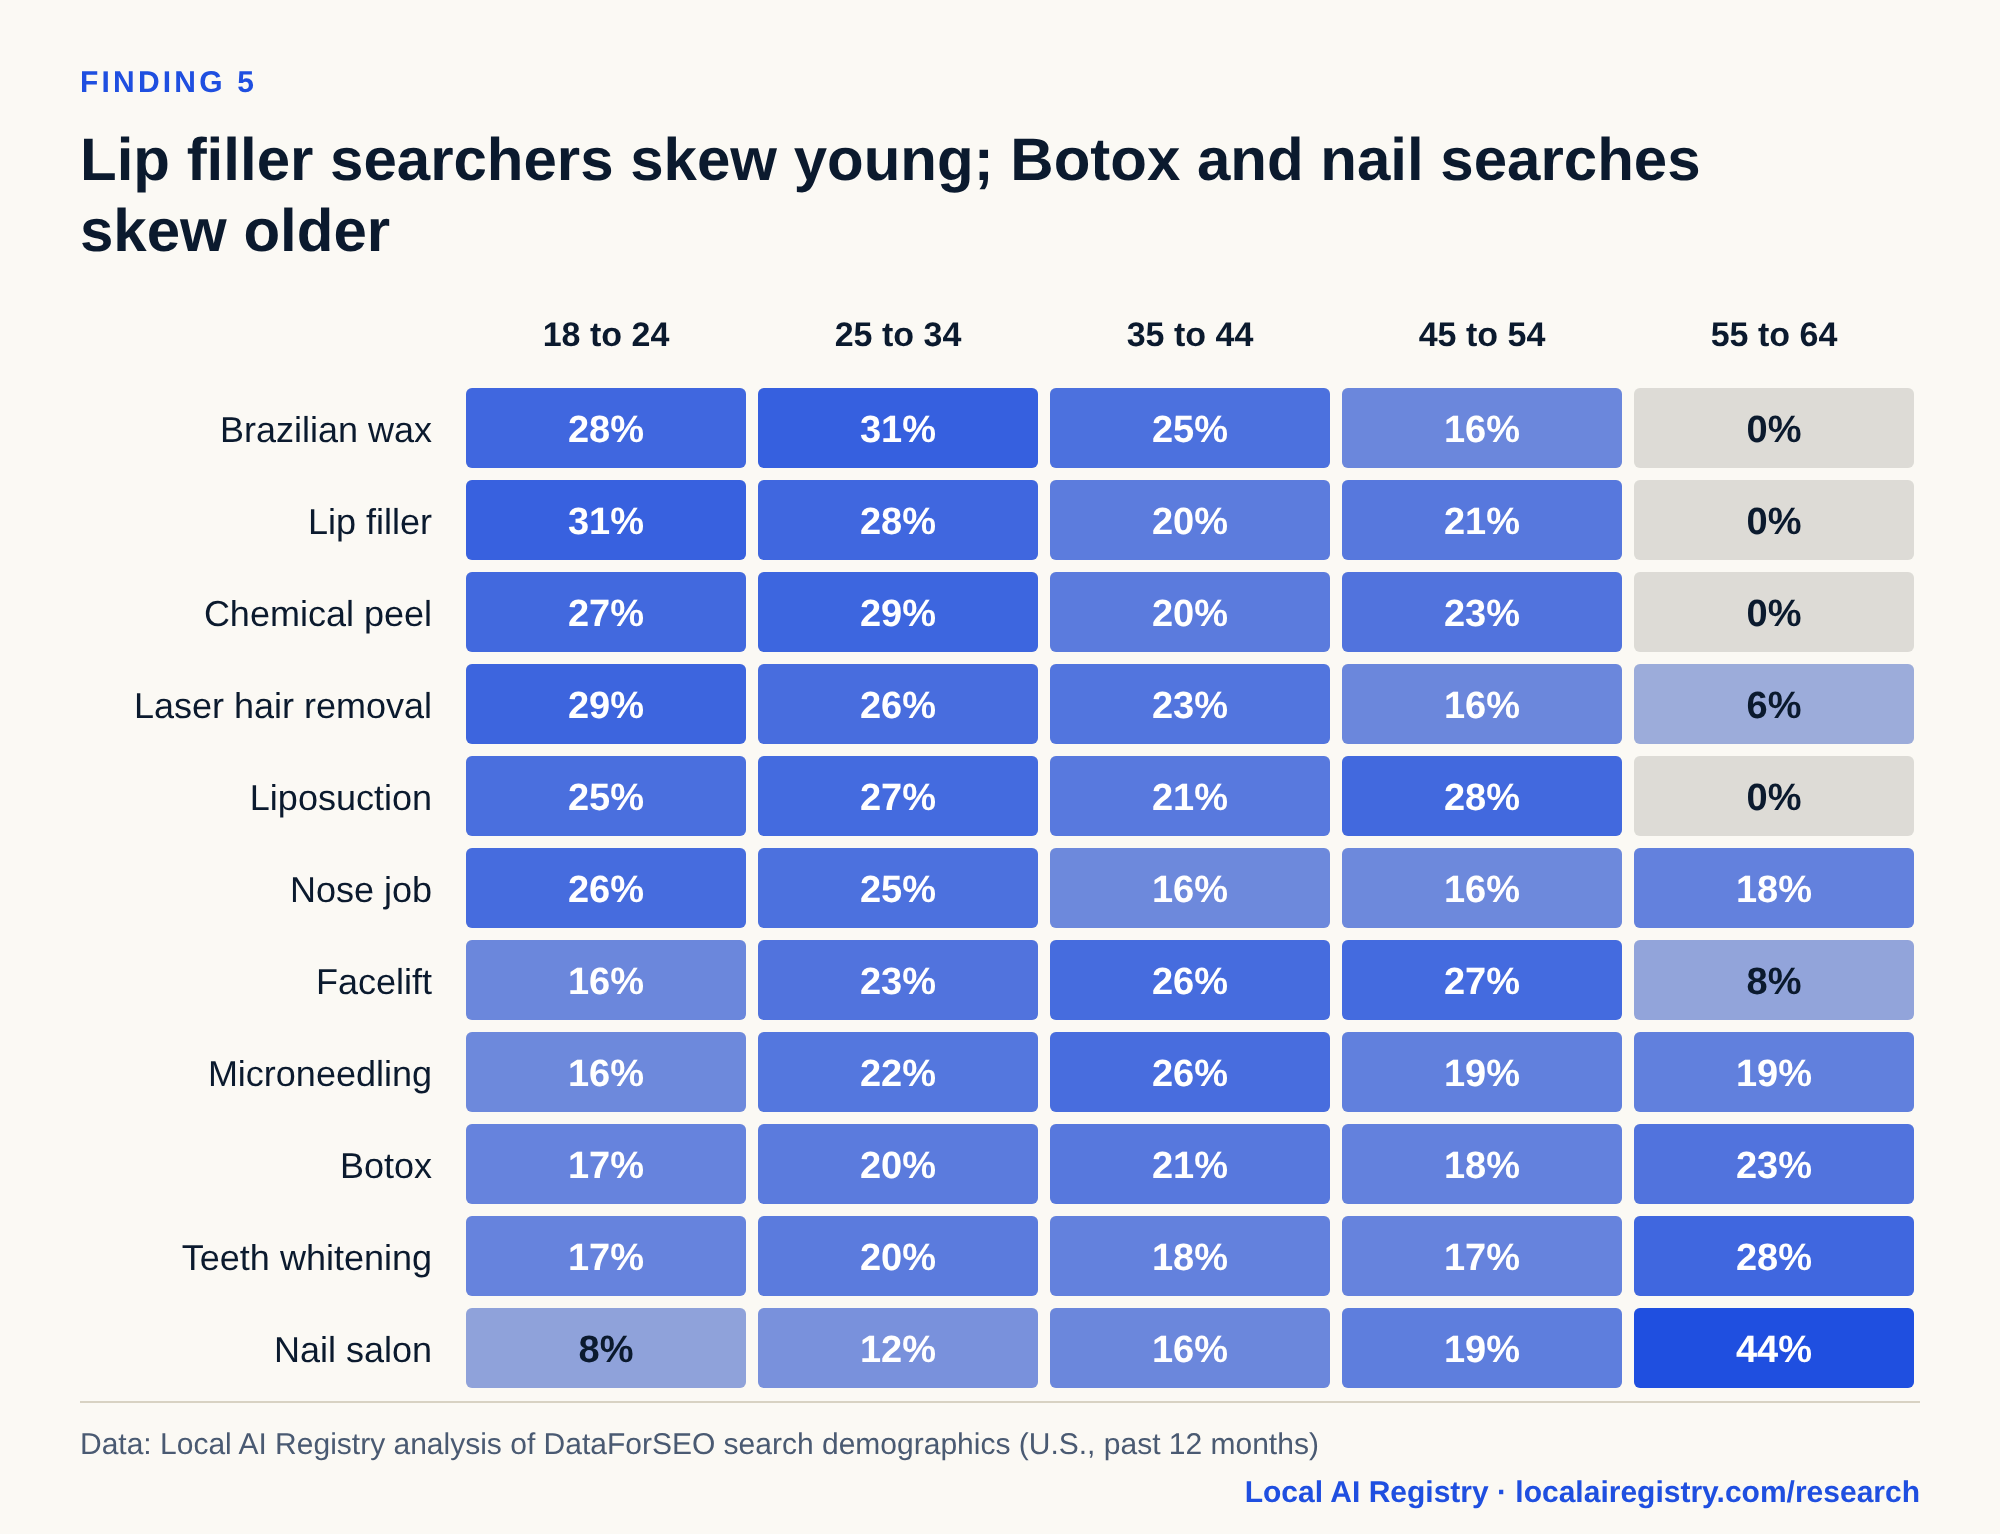
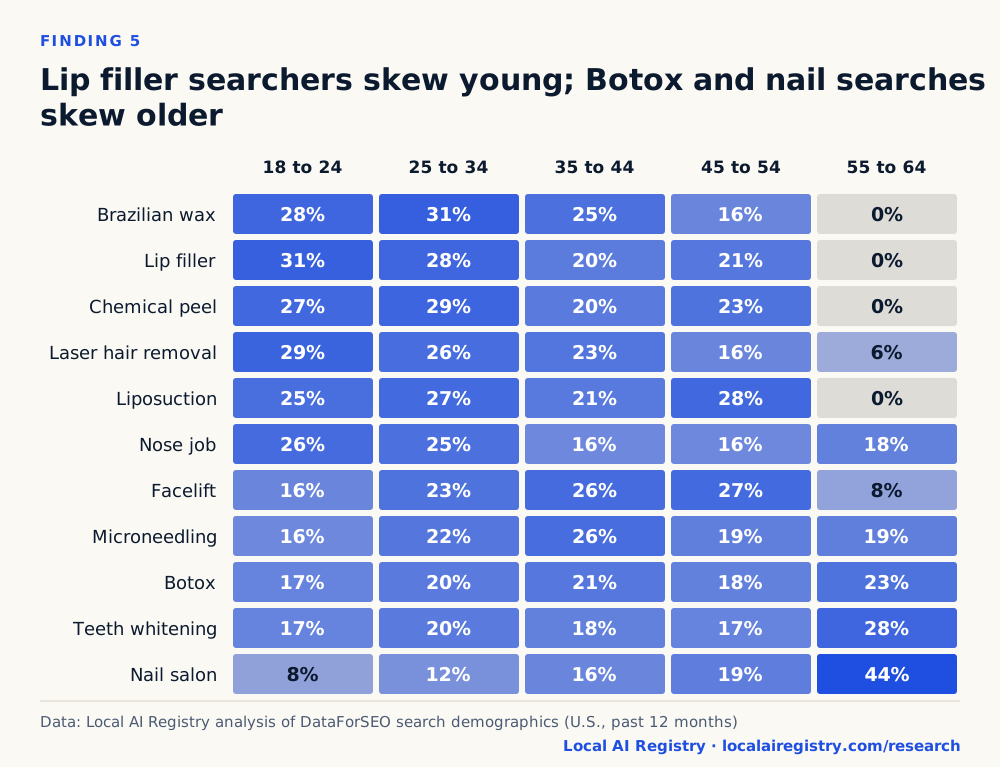
Men search for surgery about as often as for anything else (46%) but rarely for upkeep (22% to 33%). Lip filler searchers are about 33; Botox searchers about 41.
Data behind this chart
| Search | Men's share of searches |
|---|---|
| Liposuction | 46% |
| Facelift | 46% |
| Nose job | 46% |
| Teeth whitening | 41% |
| Lip filler | 38% |
| Botox | 33% |
| Hair salon | 33% |
| Nail salon | 28% |
| Lash extensions | 28% |
| Spray tan | 22% |
Data behind this chart
| Search | 18 to 24 | 25 to 34 | 35 to 44 | 45 to 54 | 55 to 64 | Typical age |
|---|---|---|---|---|---|---|
| Brazilian wax | 28% | 31% | 25% | 16% | 0% | 33 |
| Lip filler | 31% | 28% | 20% | 21% | 0% | 33 |
| Chemical peel | 27% | 29% | 20% | 23% | 0% | 34 |
| Laser hair removal | 29% | 26% | 23% | 16% | 6% | 34 |
| Liposuction | 25% | 27% | 21% | 28% | 0% | 35 |
| Nose job | 26% | 25% | 16% | 16% | 18% | 37 |
| Facelift | 16% | 23% | 26% | 27% | 8% | 38 |
| Microneedling | 16% | 22% | 26% | 19% | 19% | 40 |
| Botox | 17% | 20% | 21% | 18% | 23% | 41 |
| Teeth whitening | 17% | 20% | 18% | 17% | 28% | 42 |
| Nail salon | 8% | 12% | 16% | 19% | 44% | 48 |
Data behind this chart
| Age of household head | Personal care spending, 2024 |
|---|---|
| Under 25 | 647 |
| 25 to 34 | 863 |
| 35 to 44 | 1202 |
| 45 to 54 | 1226 |
| 55 to 64 | 1023 |
| 65 and over | 782 |
| All households | 978 |
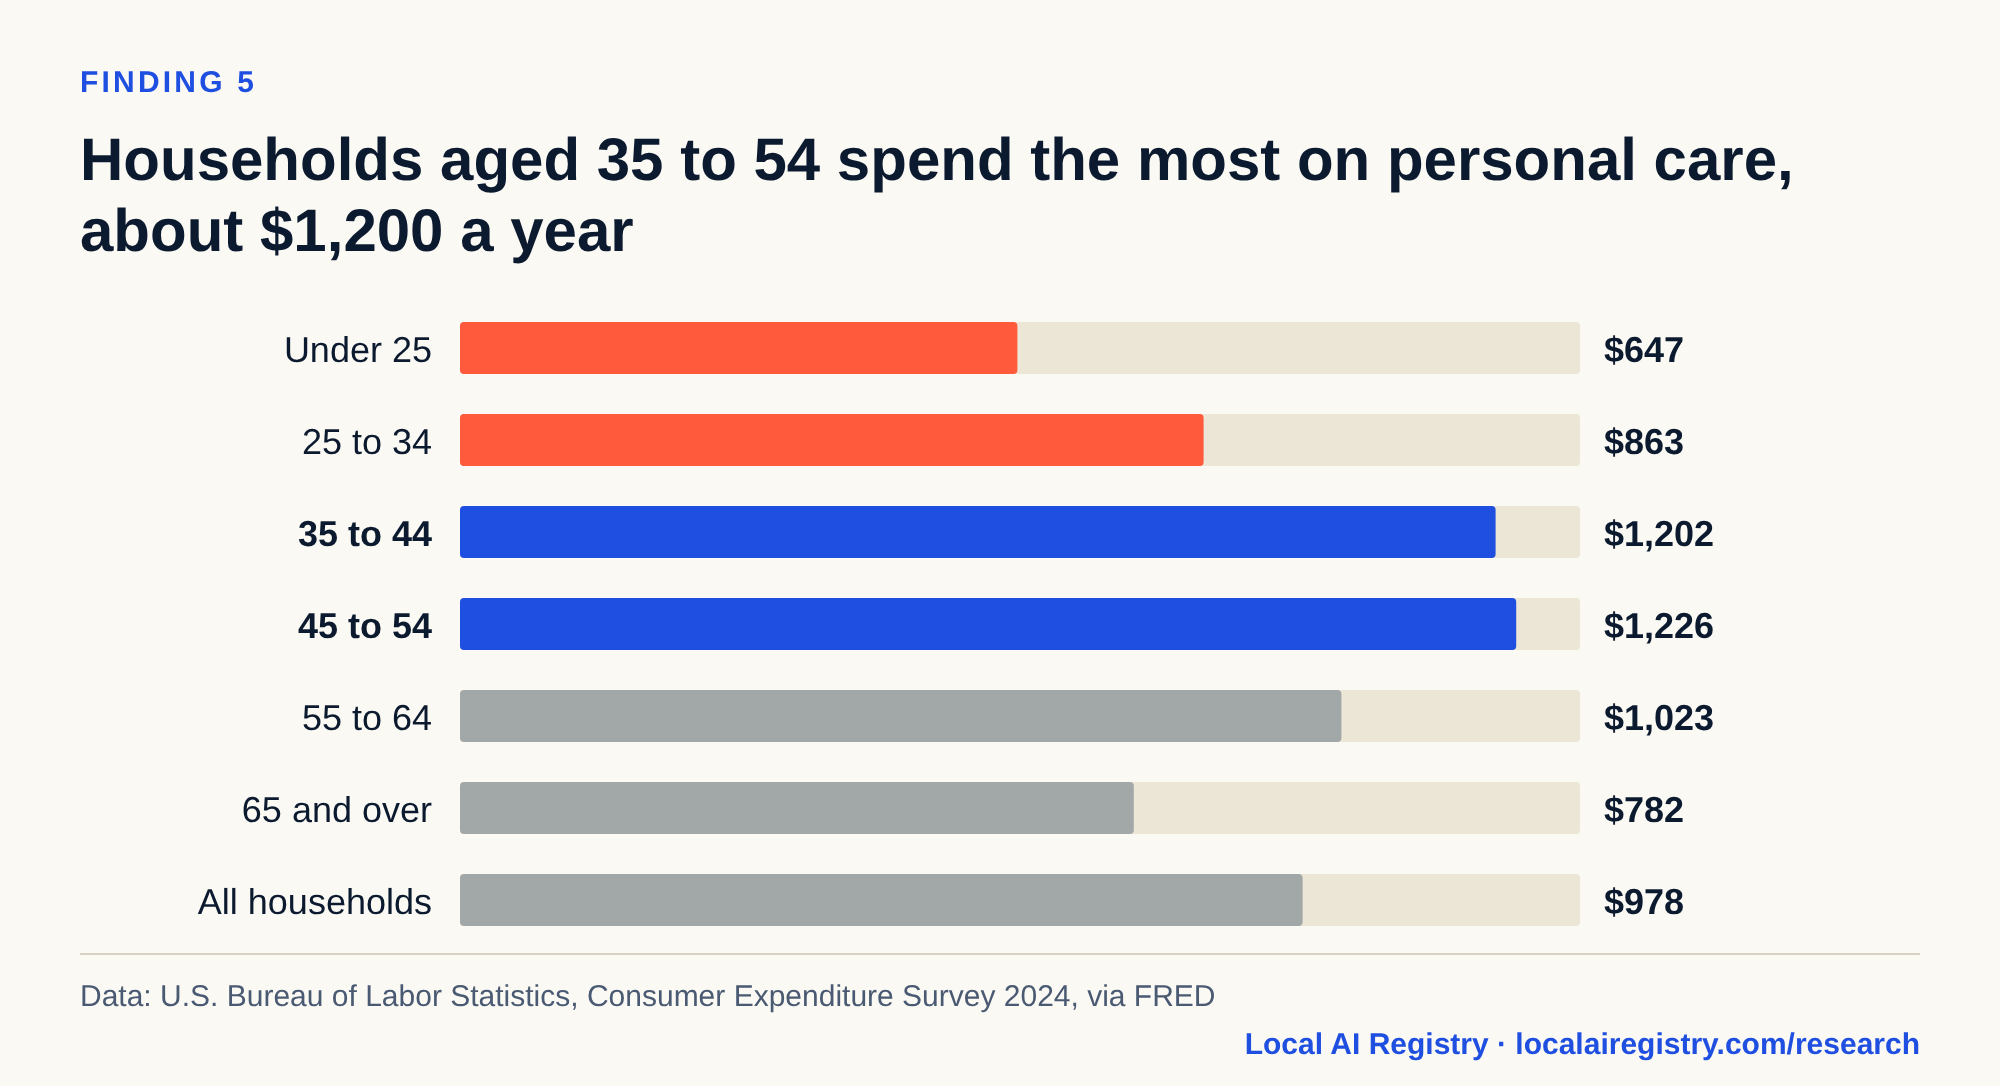
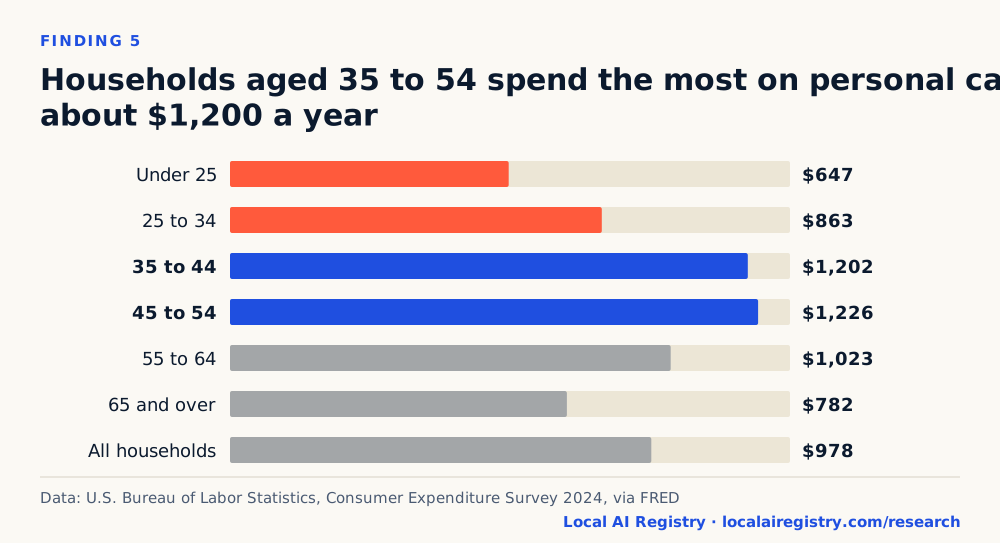
The youngest treatment searchers sit in the households that spend least on personal care: $647 a year under 25 and $863 at 25 to 34, against about $1,200 at 35 to 54. In a 2026 Zenoti survey, 26% of Gen Z had delayed medical or dental care to pay for beauty, against 11% of boomers. For younger treatments, payment plans and memberships matter most.
When do clients research, and when do they buy?
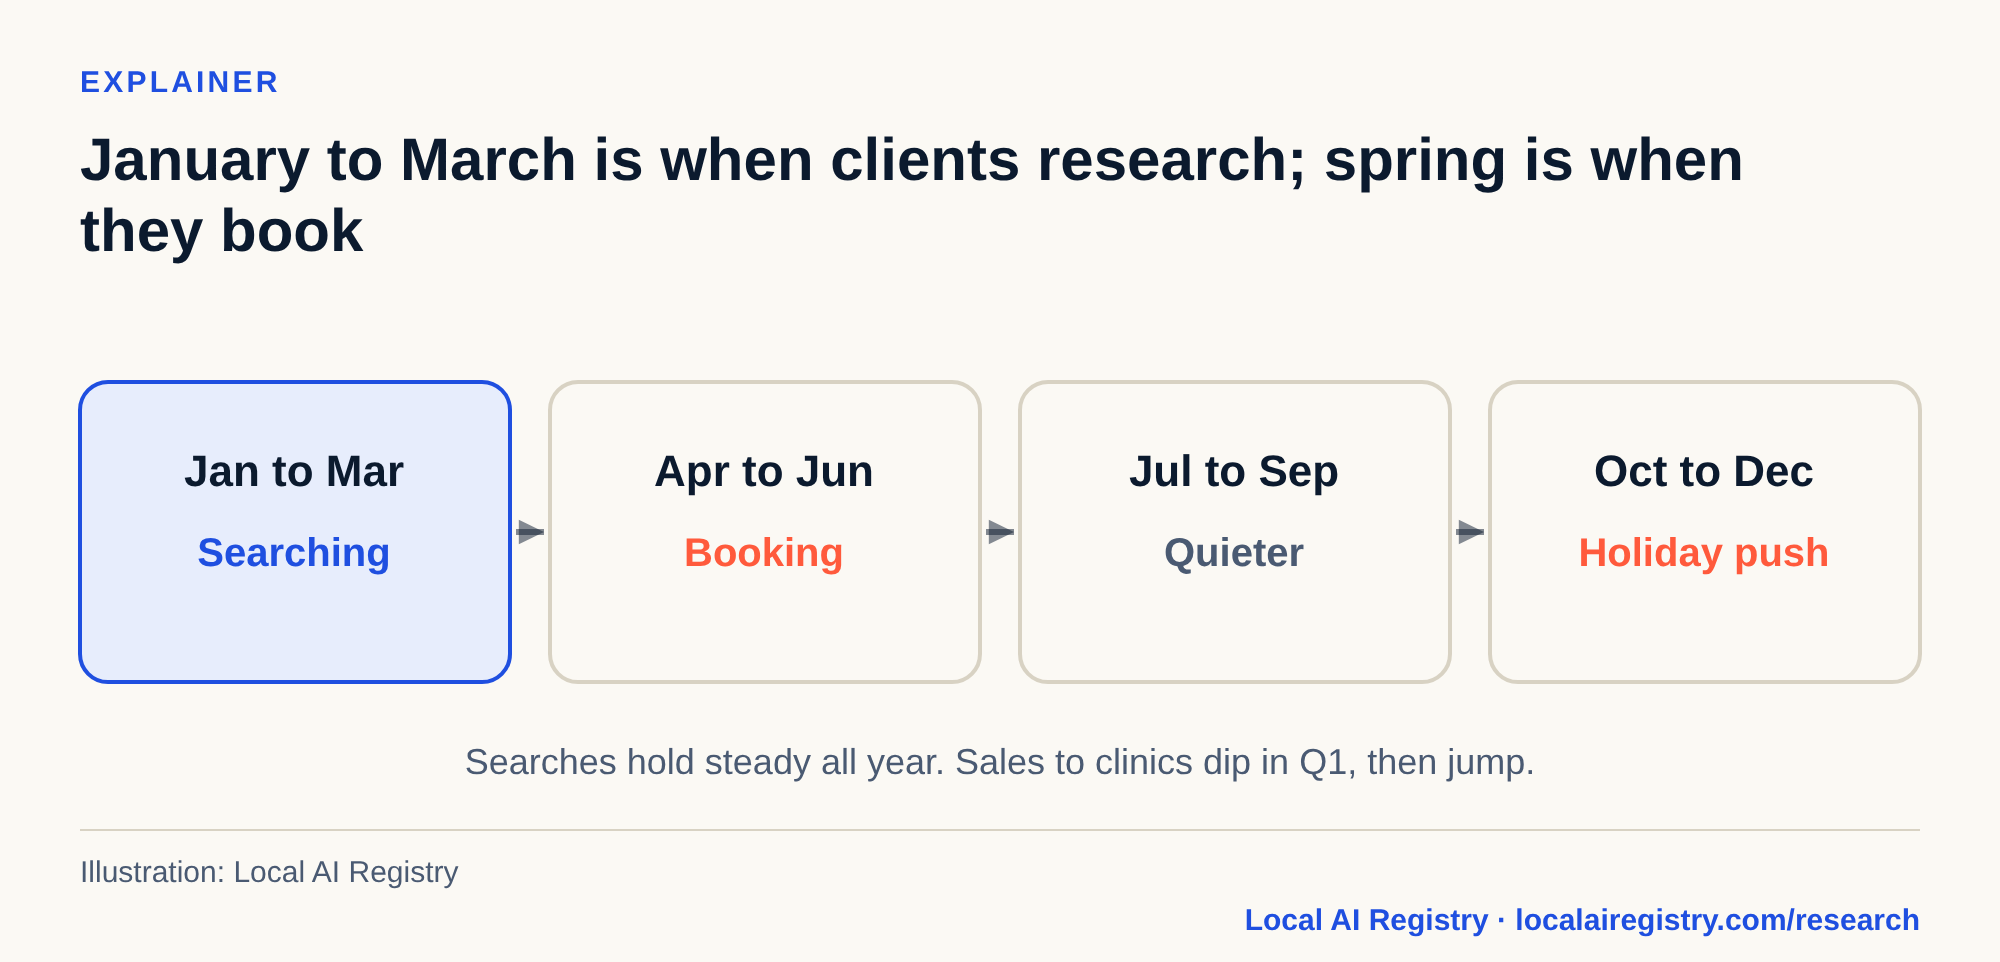
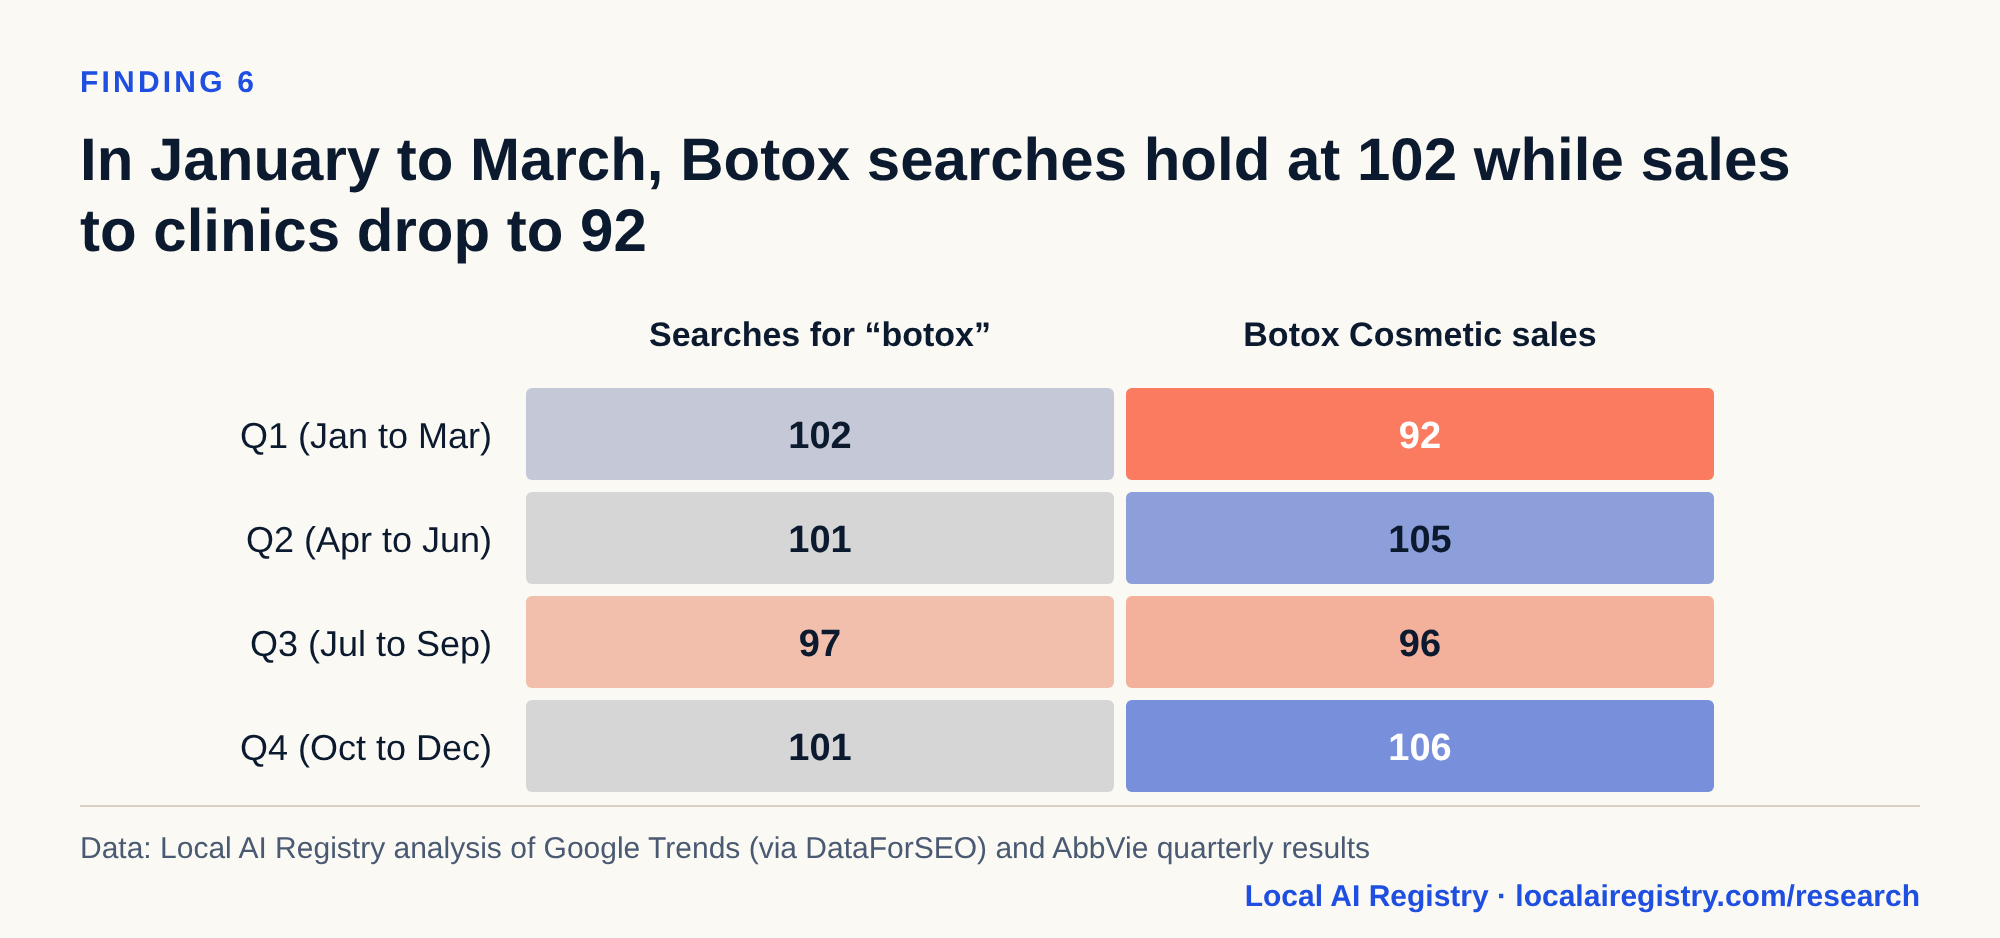
Clients research all year, including January to March. Botox searches hold at 102 in Q1 while Botox sales to clinics drop to 92.
Data behind this chart
| Quarter | Searches (year average = 100) | Botox Cosmetic sales (year average = 100) |
|---|---|---|
| Q1 | 102 | 92 |
| Q2 | 101 | 105 |
| Q3 | 97 | 96 |
| Q4 | 101 | 106 |
These are AbbVie’s sales to practices, not what patients pay, so clinics stocking up in Q4 explains part of the Q1 dip. Even so, searches do not take a break after the holidays.
What else do aesthetic clients spend on?
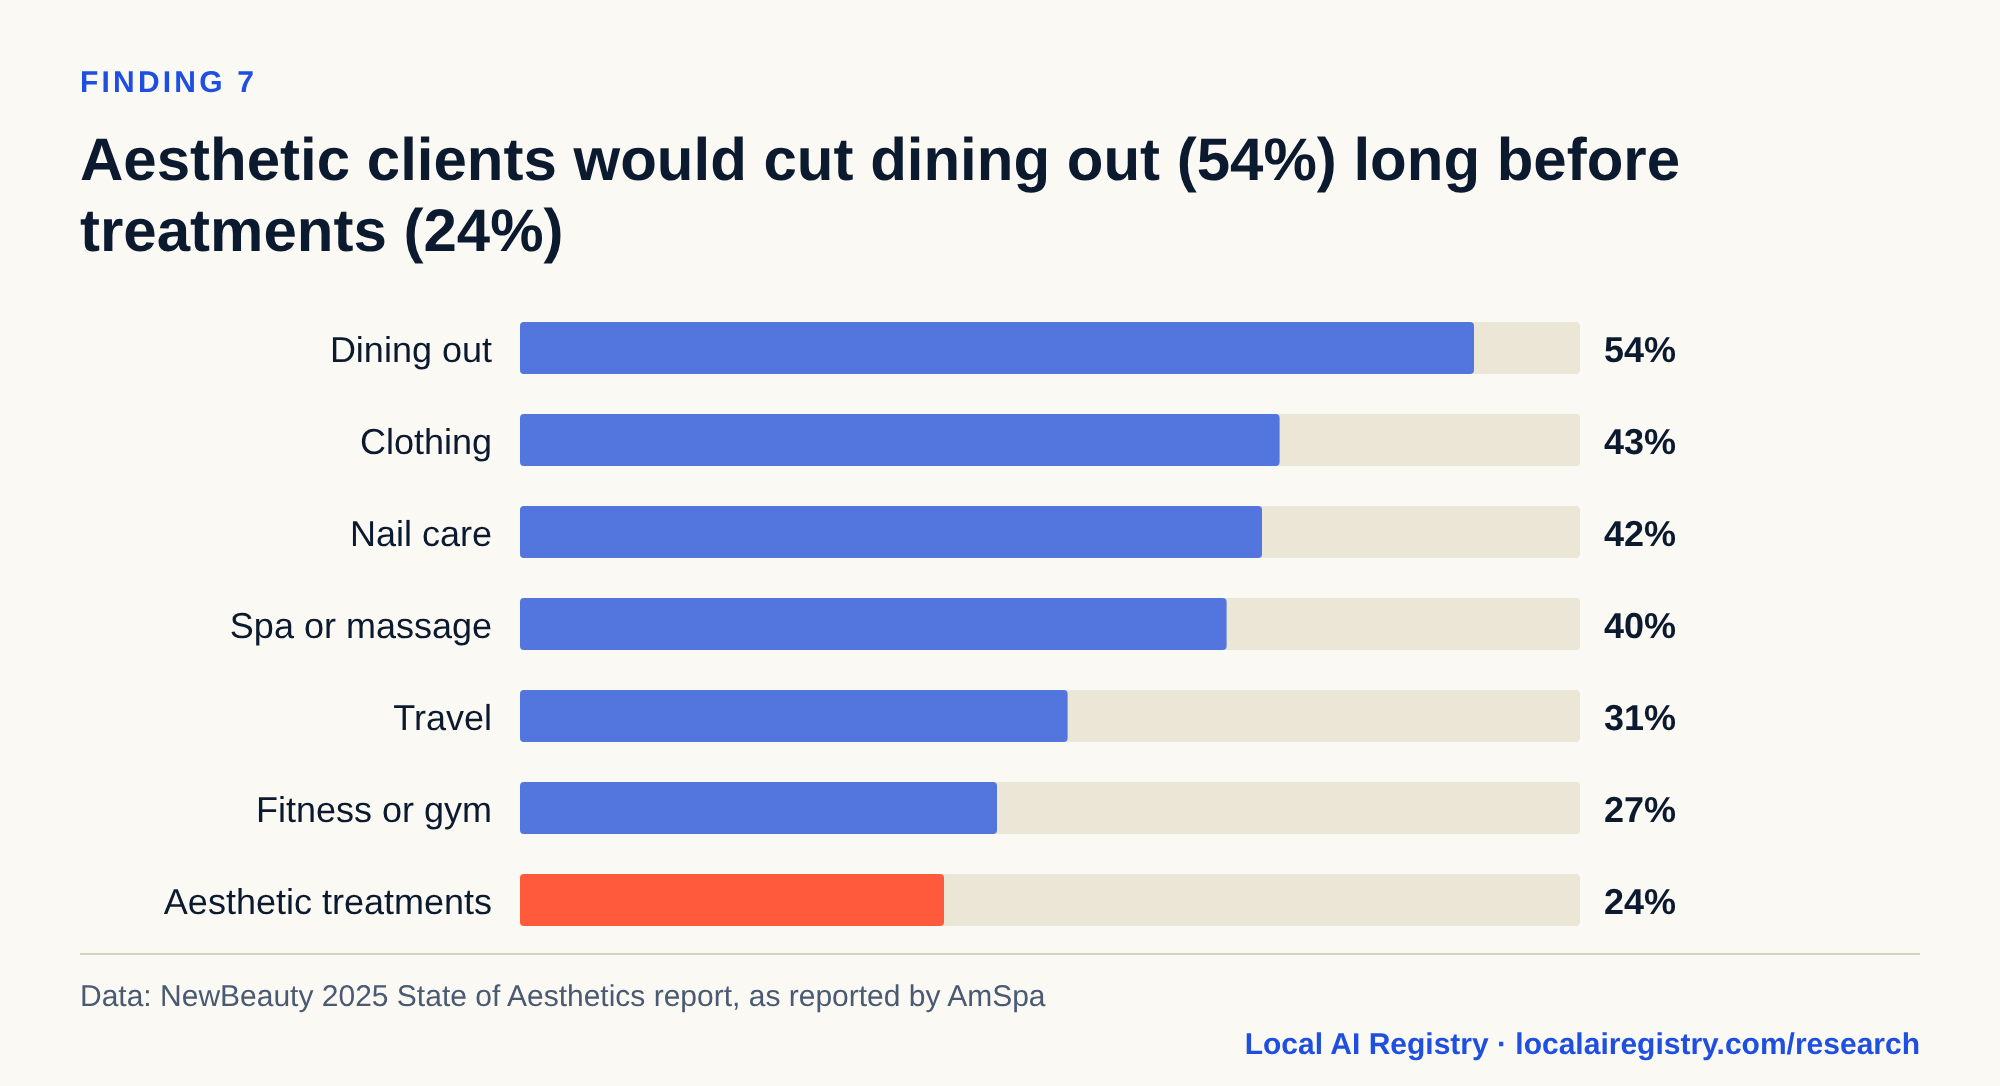
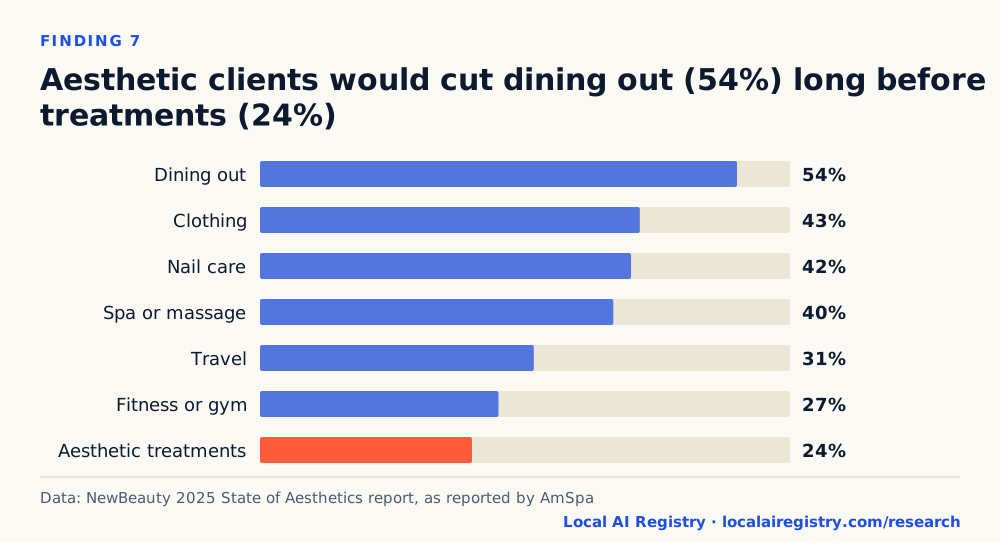
Dining out, clothing, nails and spas, in that order of what they would cut first. Treatments come last: 24% would cut them.
Data behind this chart
| Category | Share who would cut it |
|---|---|
| Dining out | 54% |
| Clothing | 43% |
| Nail care | 42% |
| Spa or massage | 40% |
| Travel | 31% |
| Fitness or gym | 27% |
| Aesthetic treatments | 24% |
Data behind this chart
| Category | State match | Age-mix overlap | Tests passed (of 3) | Best single search |
|---|---|---|---|---|
| Dating & weddings | 0.23 | 87% | 1.5 | wedding dress |
| Drinks | 0.36 | 84% | 0.9 | wine |
| Fitness & active | 0.28 | 87% | 0.8 | pilates |
| Fast food & treats | 0.25 | 86% | 0.7 | ice cream near me |
| Astrology & tarot | 0.16 | 81% | 0.8 | horoscope |
| Big-ticket buys | 0.16 | 84% | 0.5 | tesla |
| Screens & pop culture | 0.17 | 83% | 0.4 | love island |
| Weight-loss drugs | 0.08 | 87% | 0.0 | ozempic |
Data behind this chart
| Category | State match | Age-mix overlap | Tests passed |
|---|---|---|---|
| Dating & weddings | 0.23 | 87% | 1.5 |
| Drinks | 0.36 | 84% | 0.9 |
| Fitness & active | 0.28 | 87% | 0.8 |
| Fast food & treats | 0.25 | 86% | 0.7 |
| Astrology & tarot | 0.16 | 81% | 0.8 |
| Big-ticket buys | 0.16 | 84% | 0.5 |
| Screens & pop culture | 0.17 | 83% | 0.4 |
| Weight-loss drugs | 0.08 | 87% | 0.0 |
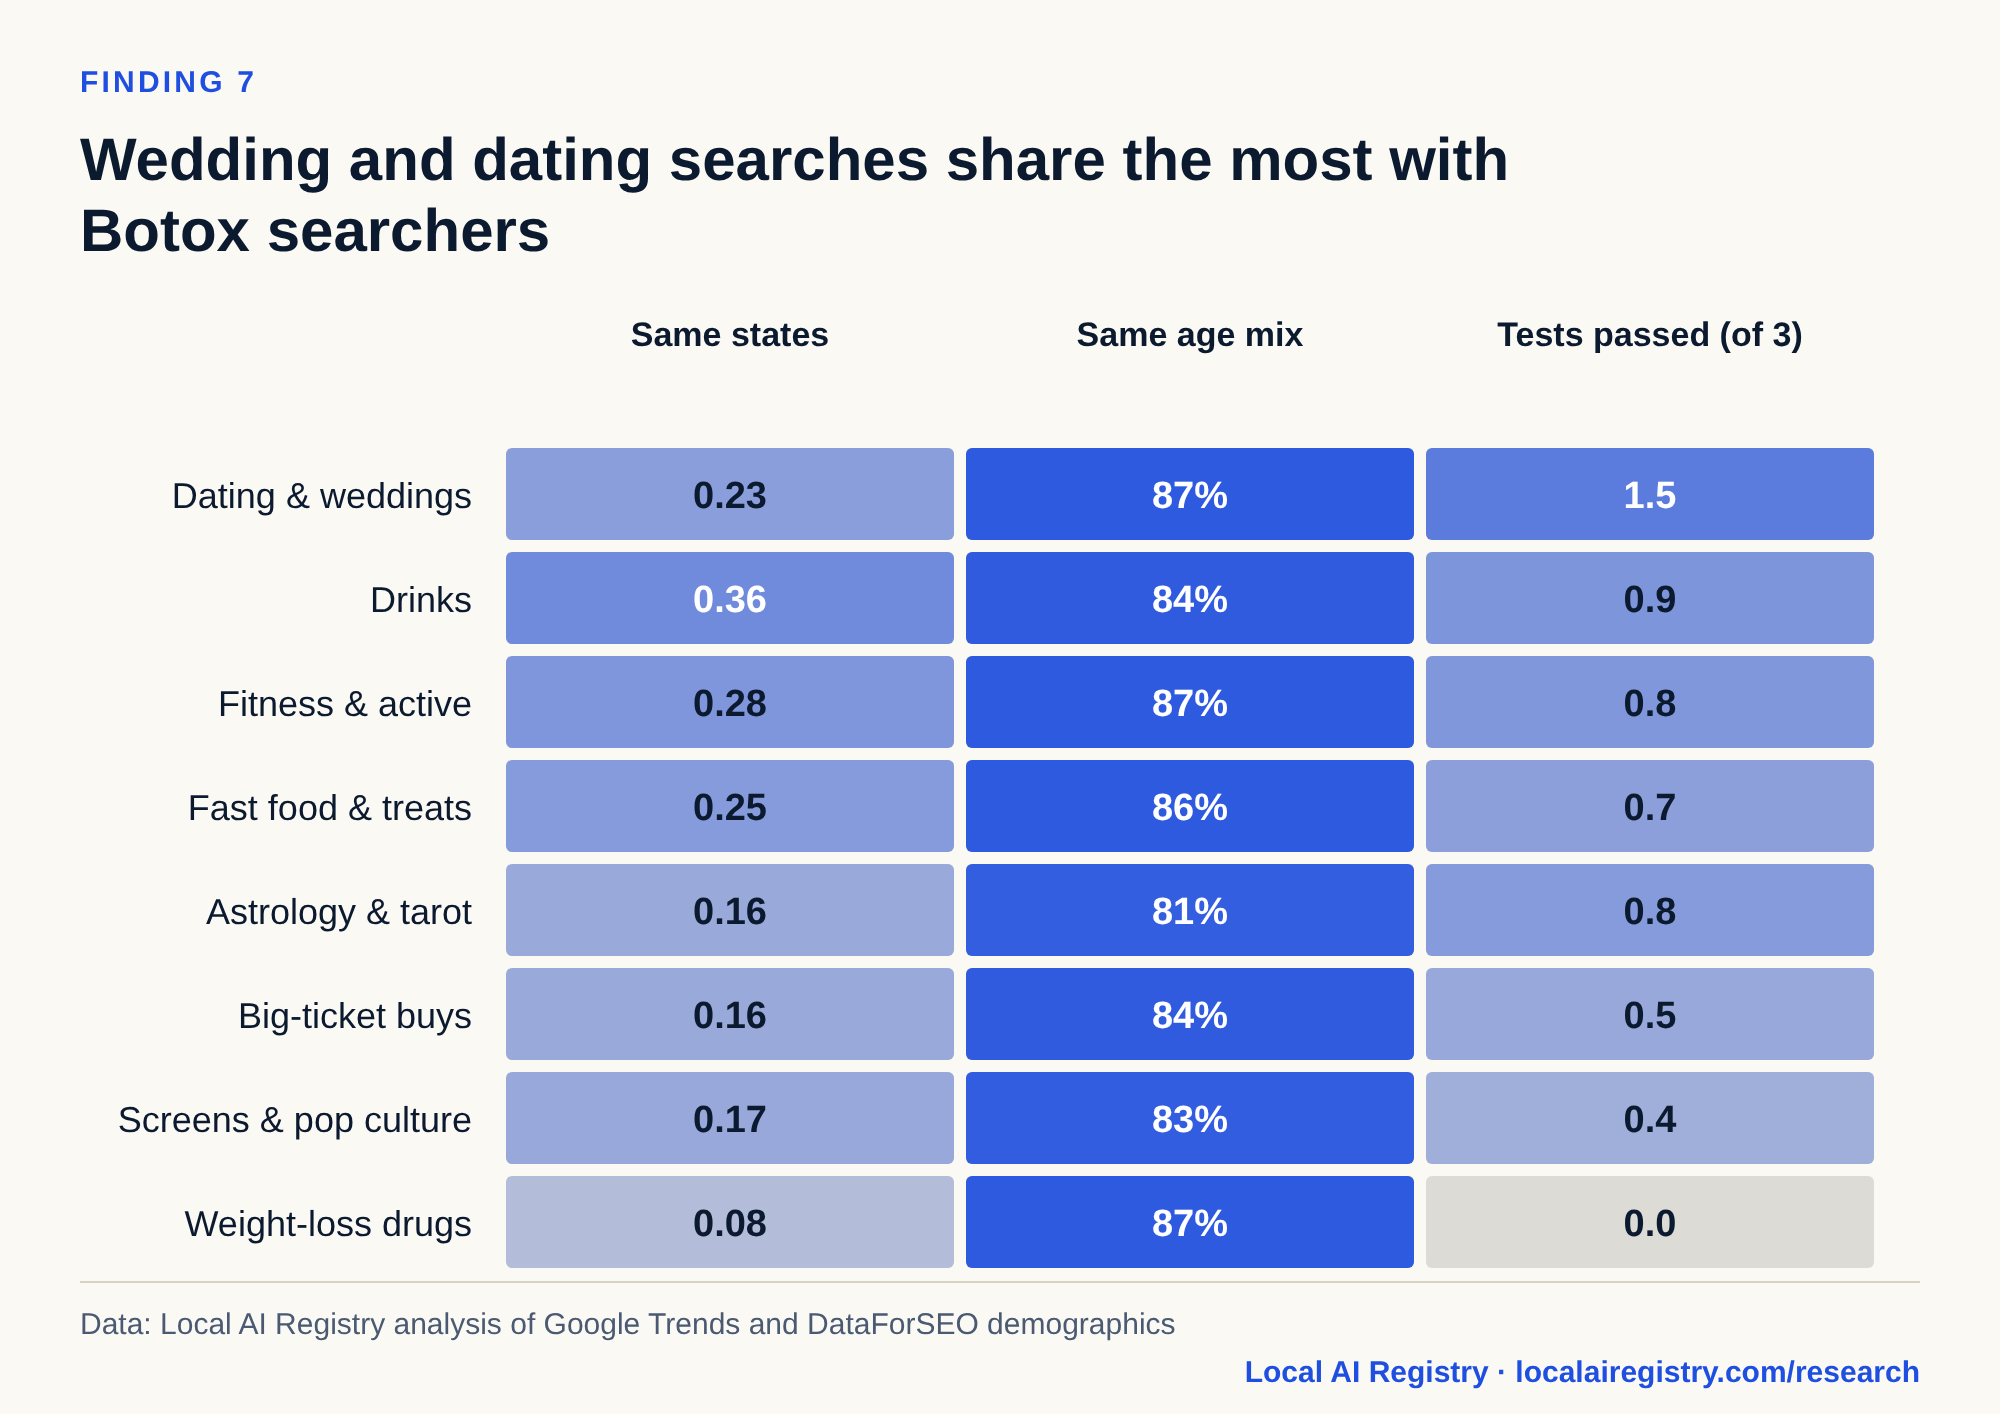
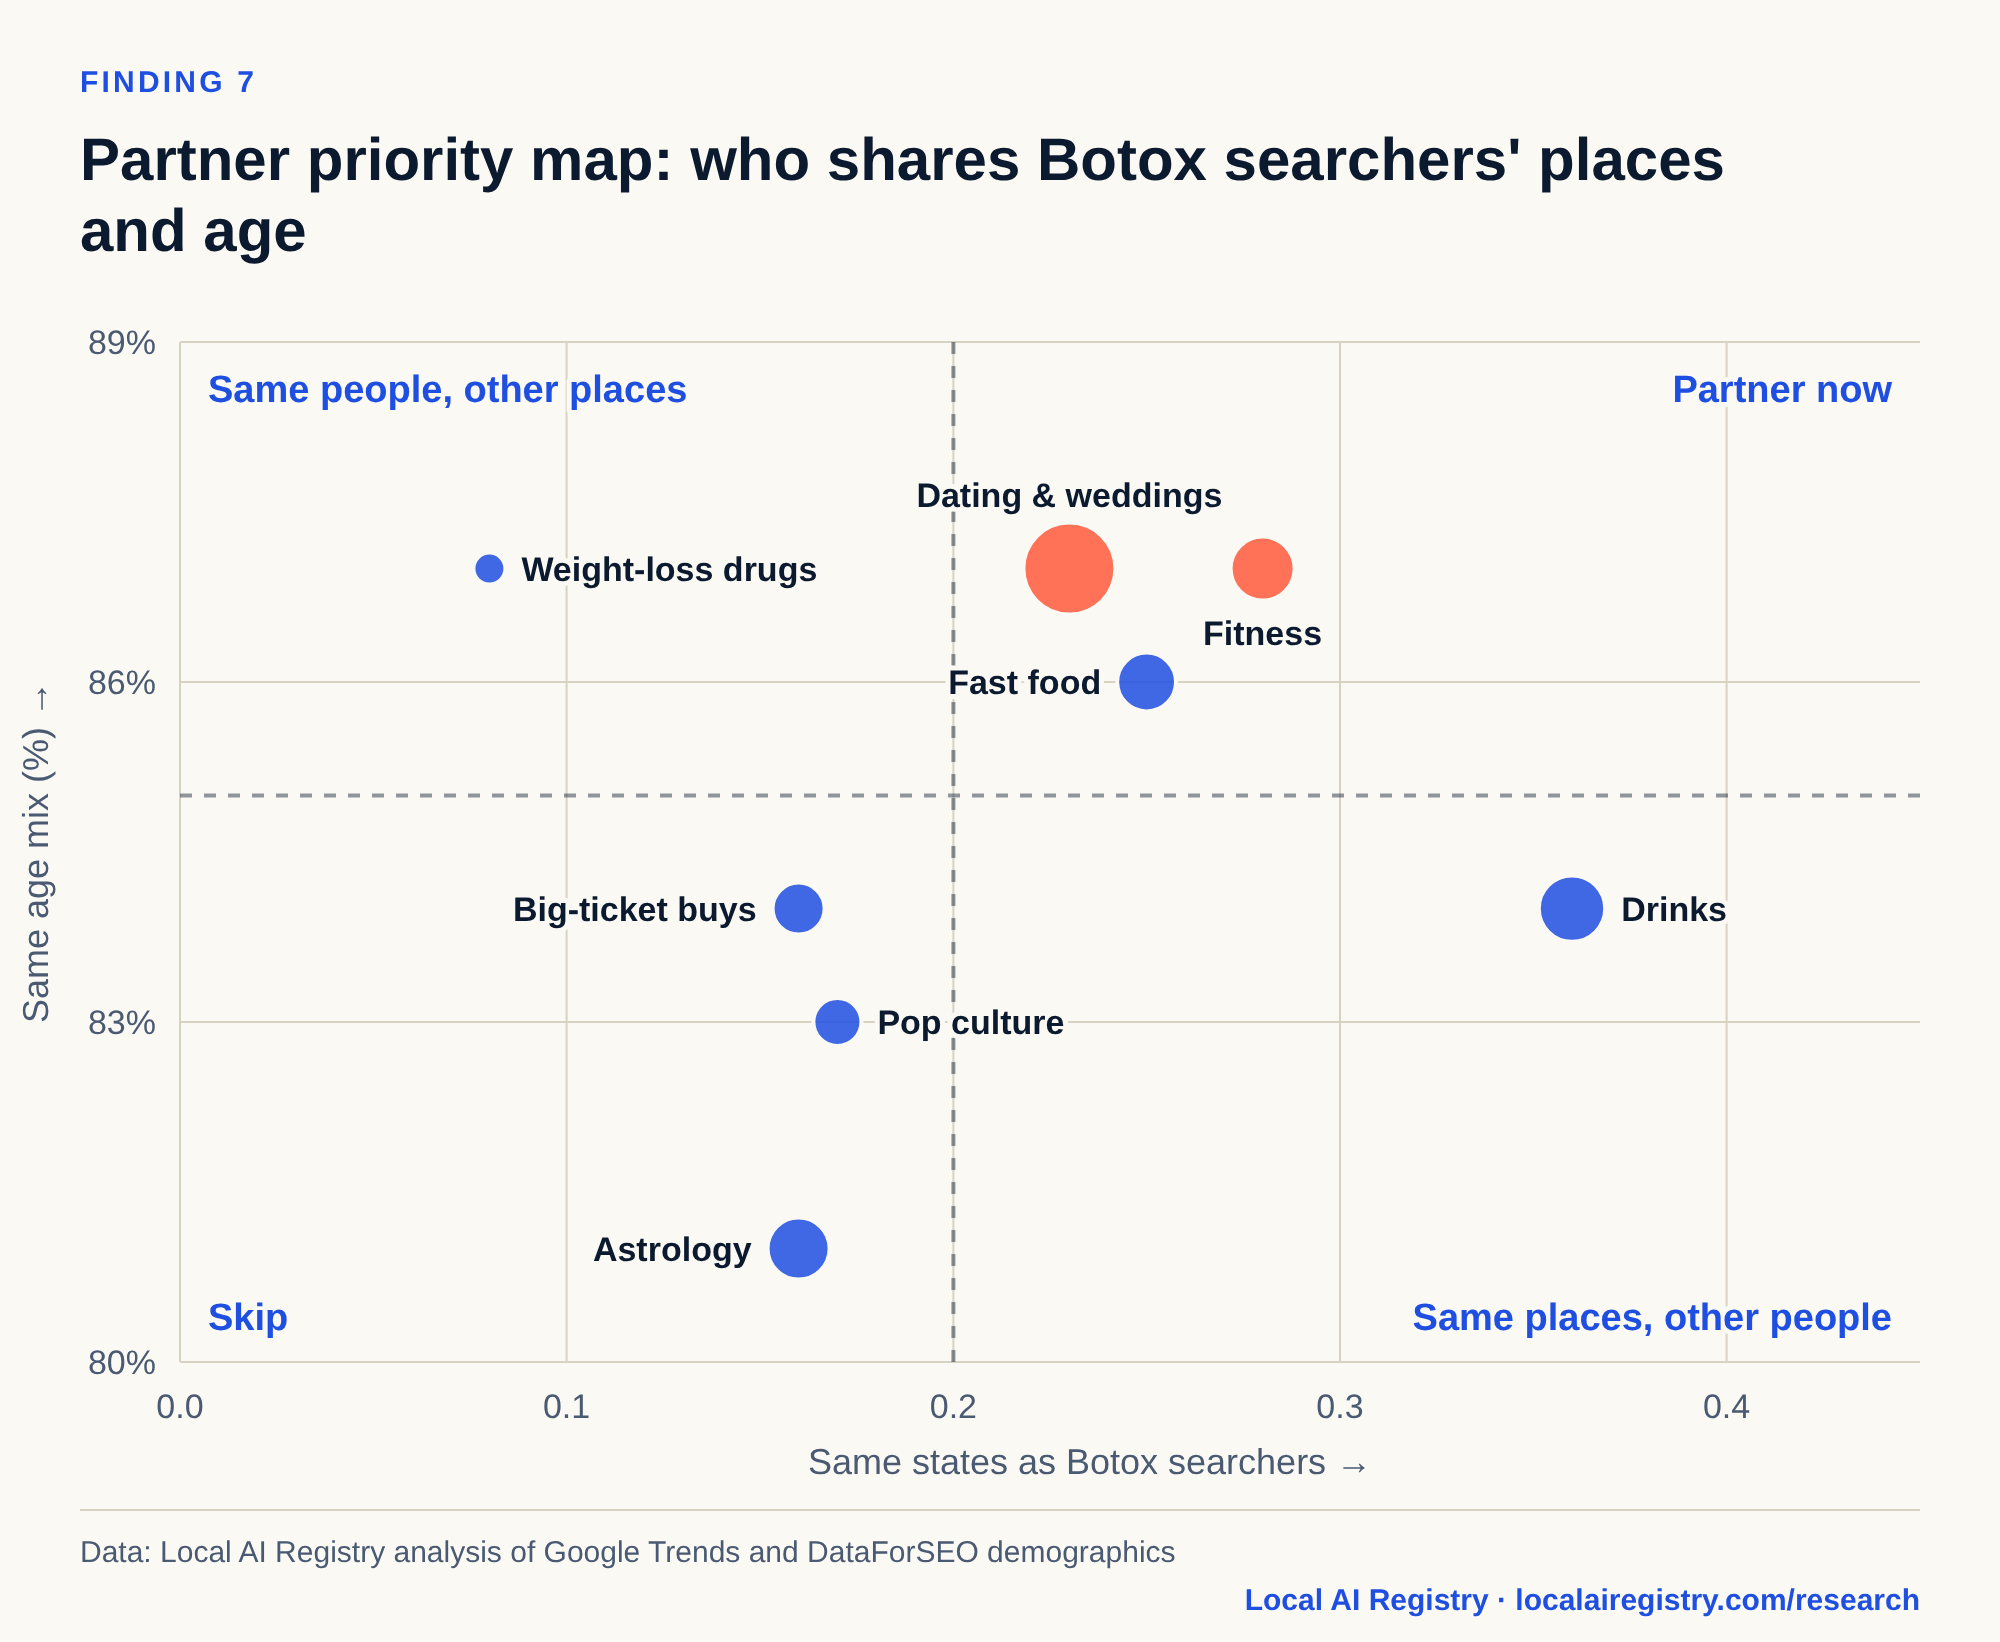
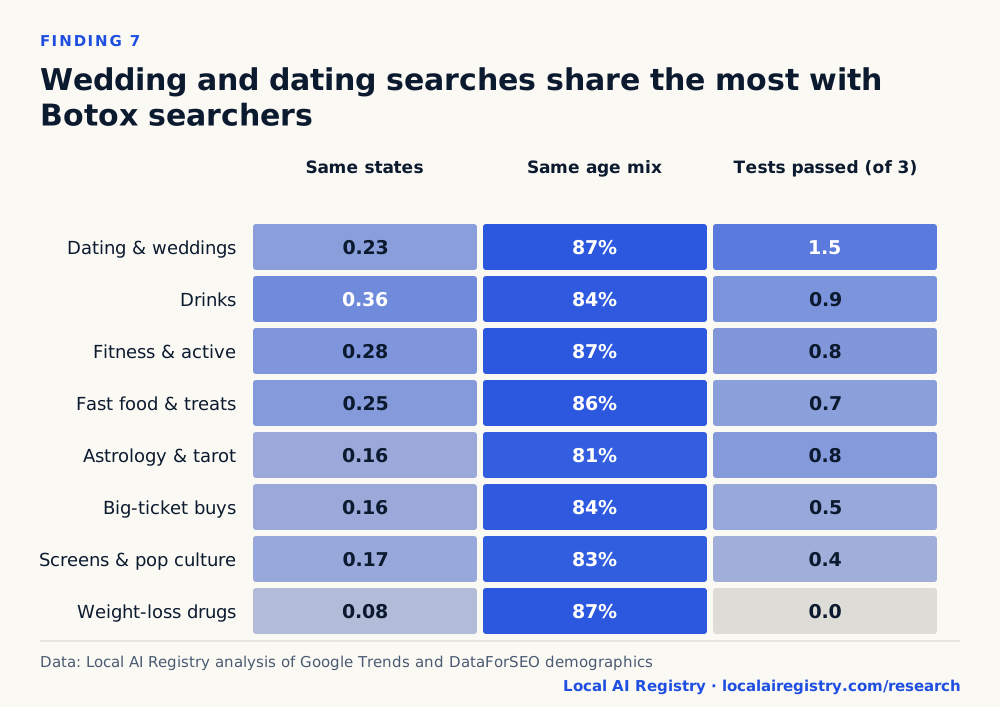
Card-level spending data on med spa clients is not public. These public sources point the same way: wedding, dating and fitness businesses share the most with Botox searchers. Wine matches best on states, but it falls under dining out, the first thing clients cut. Weight-loss drug searches share the age mix but not the states. In a 2026 Morning Consult survey for LaserAway, 53% of U.S. adults said they would give up everyday spending to afford non-surgical treatments.
Which search twins share a real audience?
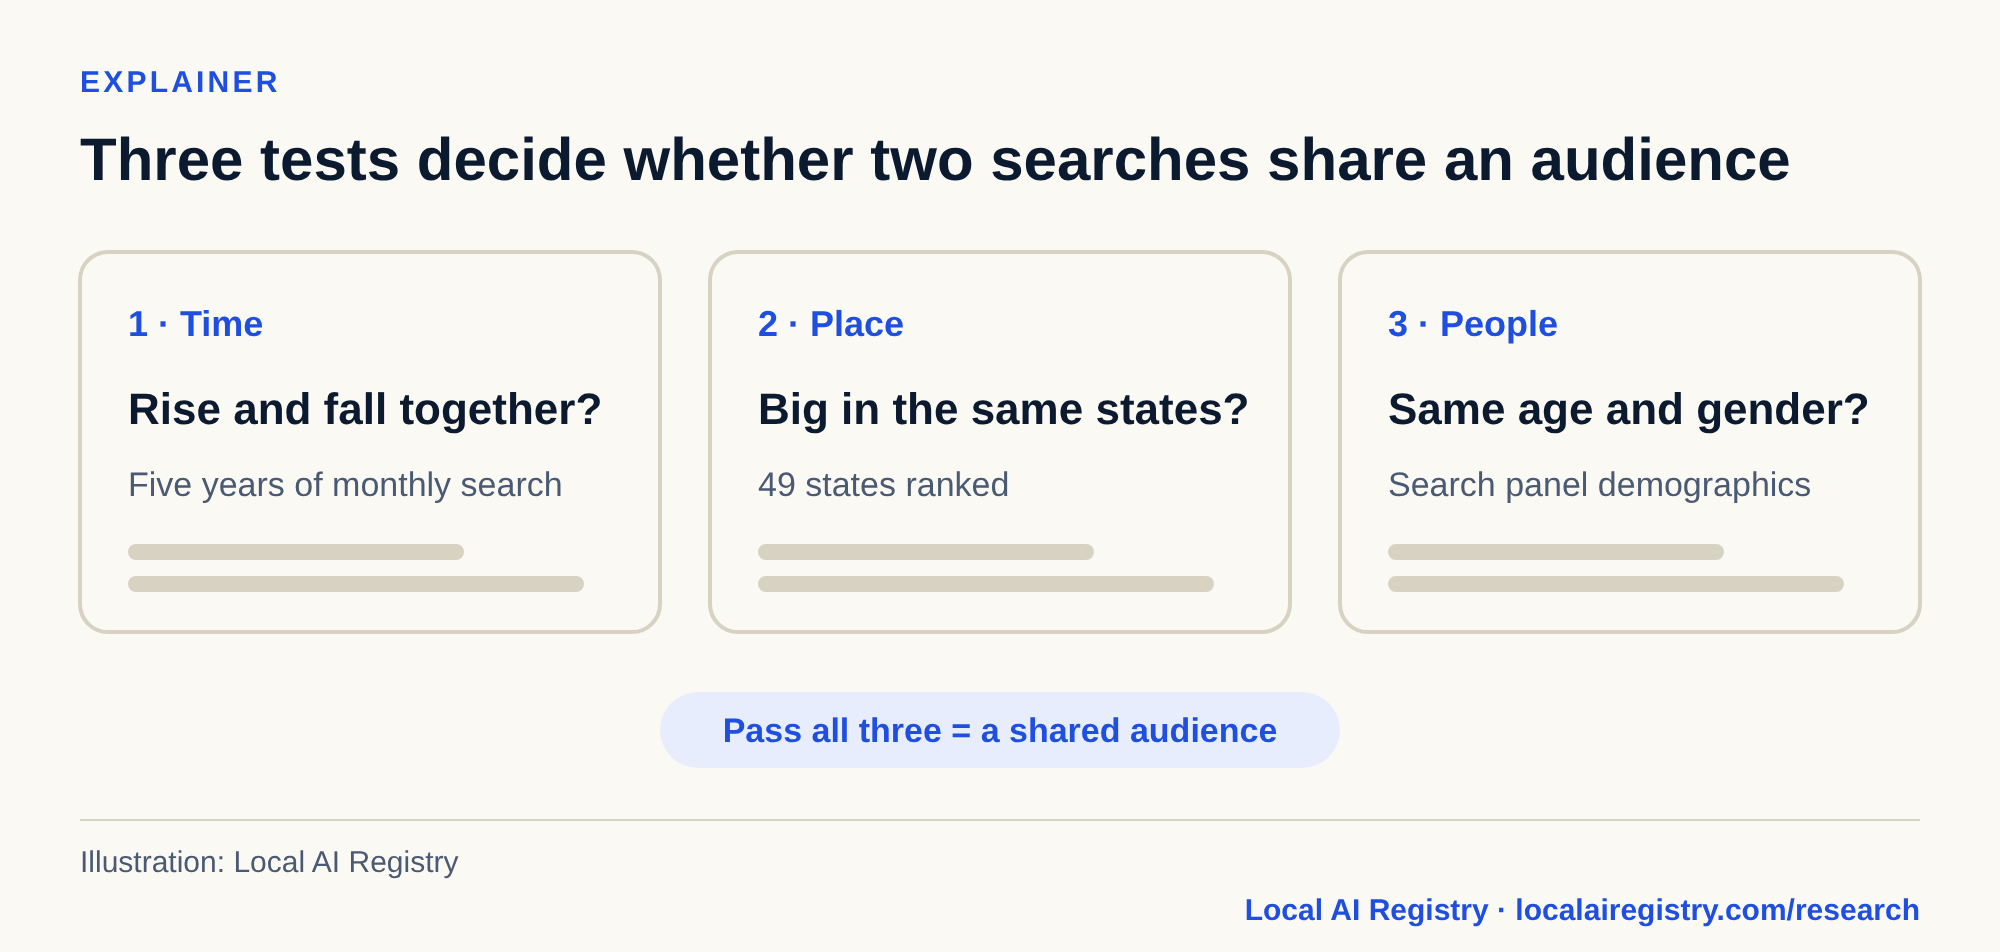
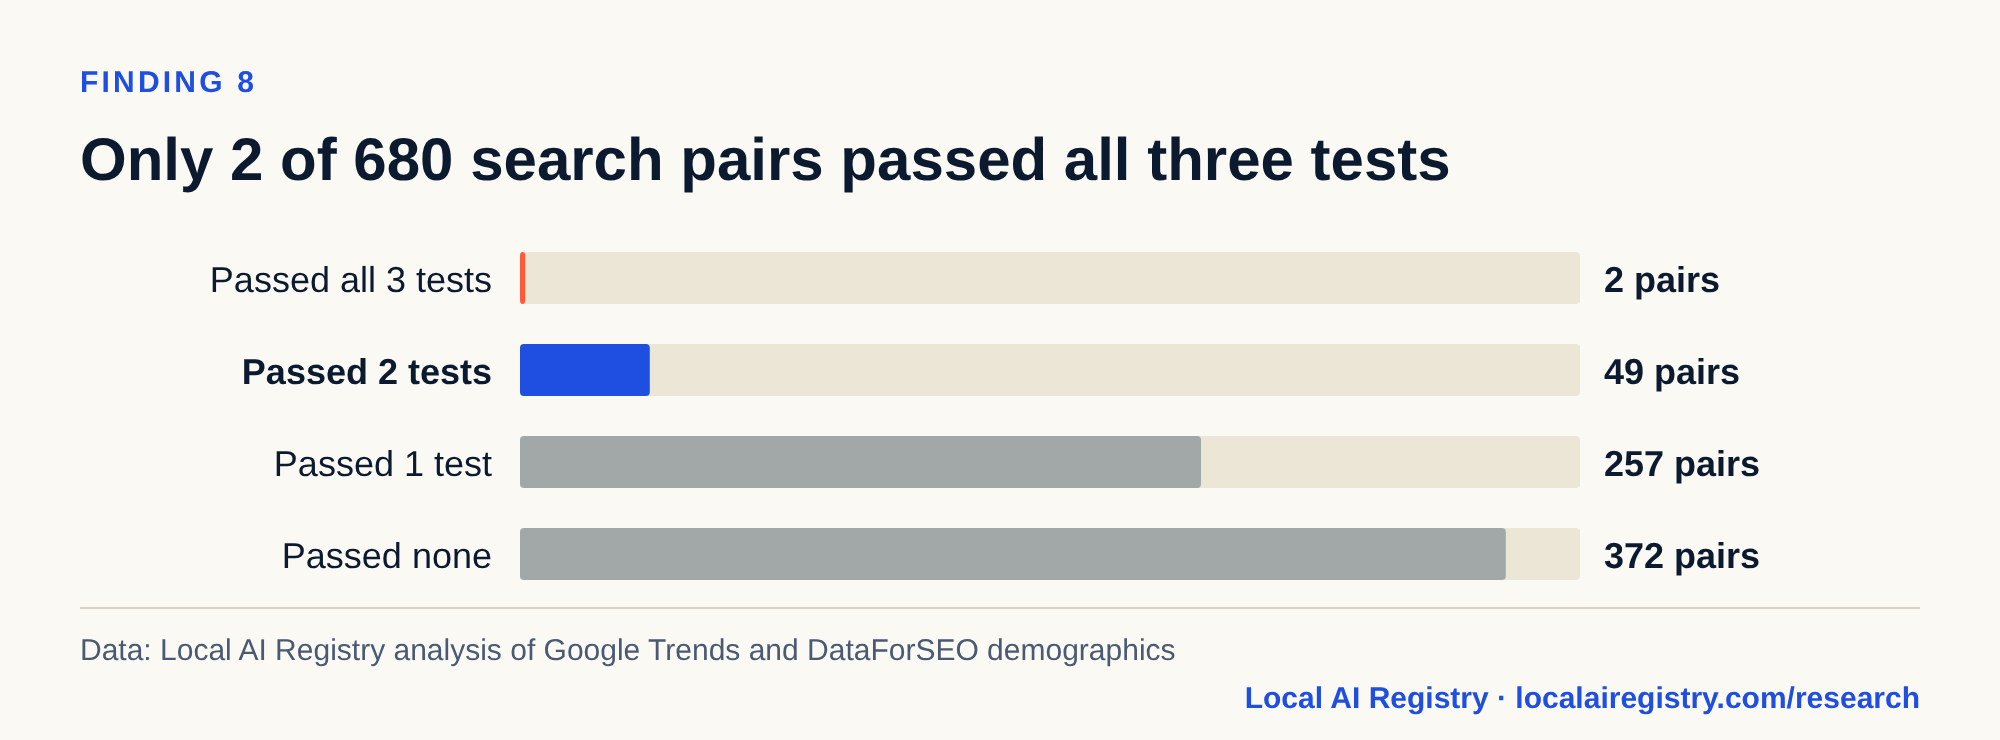
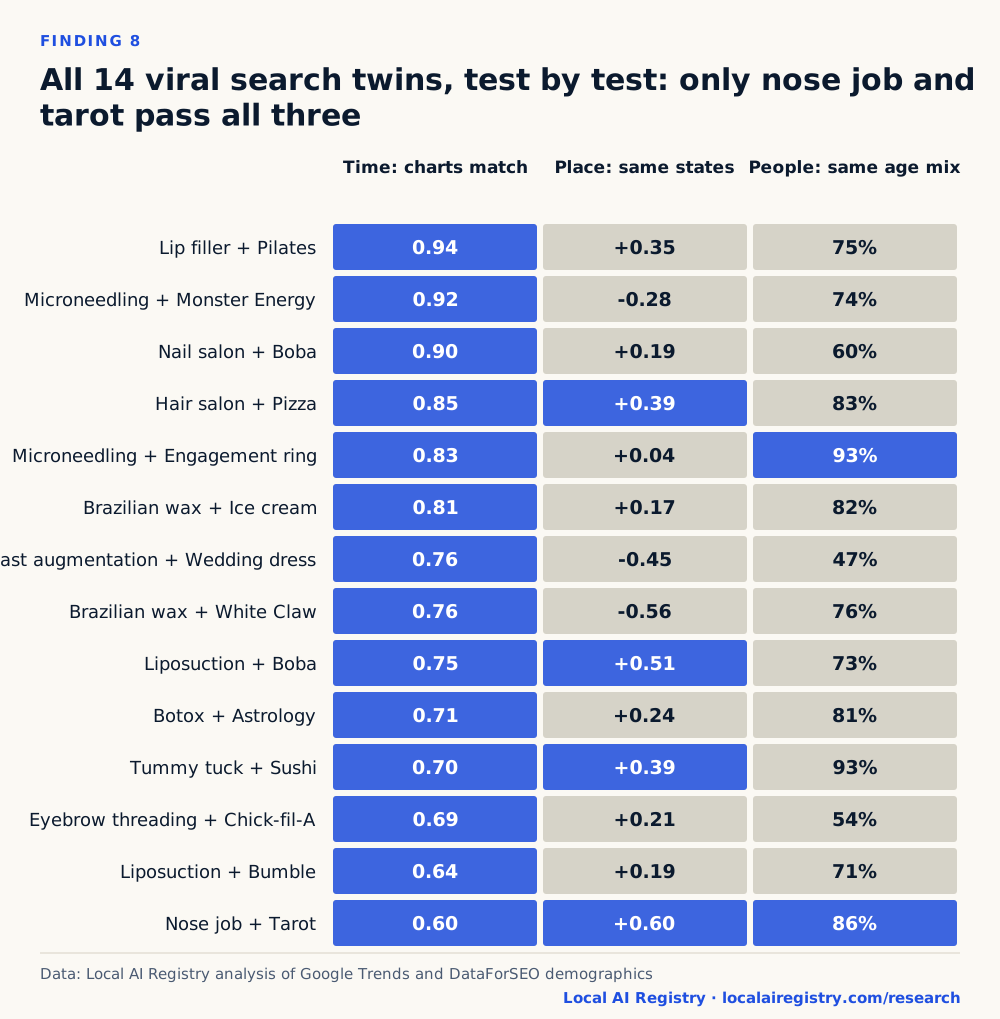
Very few. Of 680 beauty and everyday search pairs, 2 matched on timing, states and age mix: nose job with tarot, and Botox with wedding dress. Of our 14 viral pairs, only nose job and tarot held up.
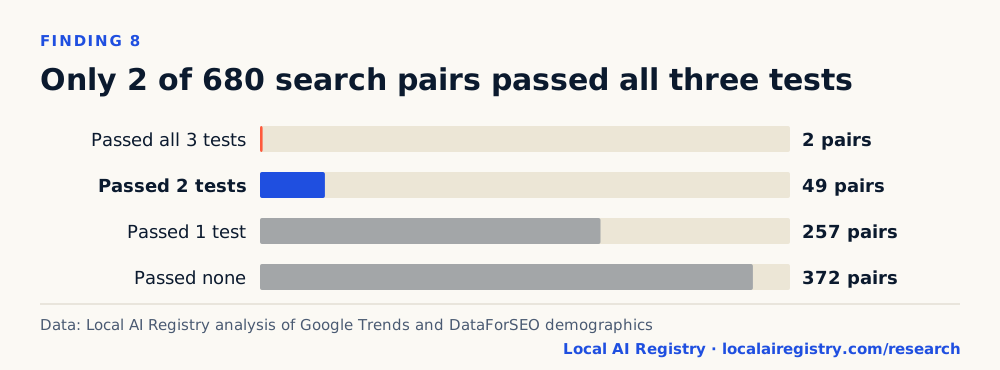
Data behind this chart
| Tests passed | Pairs |
|---|---|
| Passed all 3 tests | 2 |
| Passed 2 tests | 49 |
| Passed 1 test | 257 |
| Passed none | 372 |
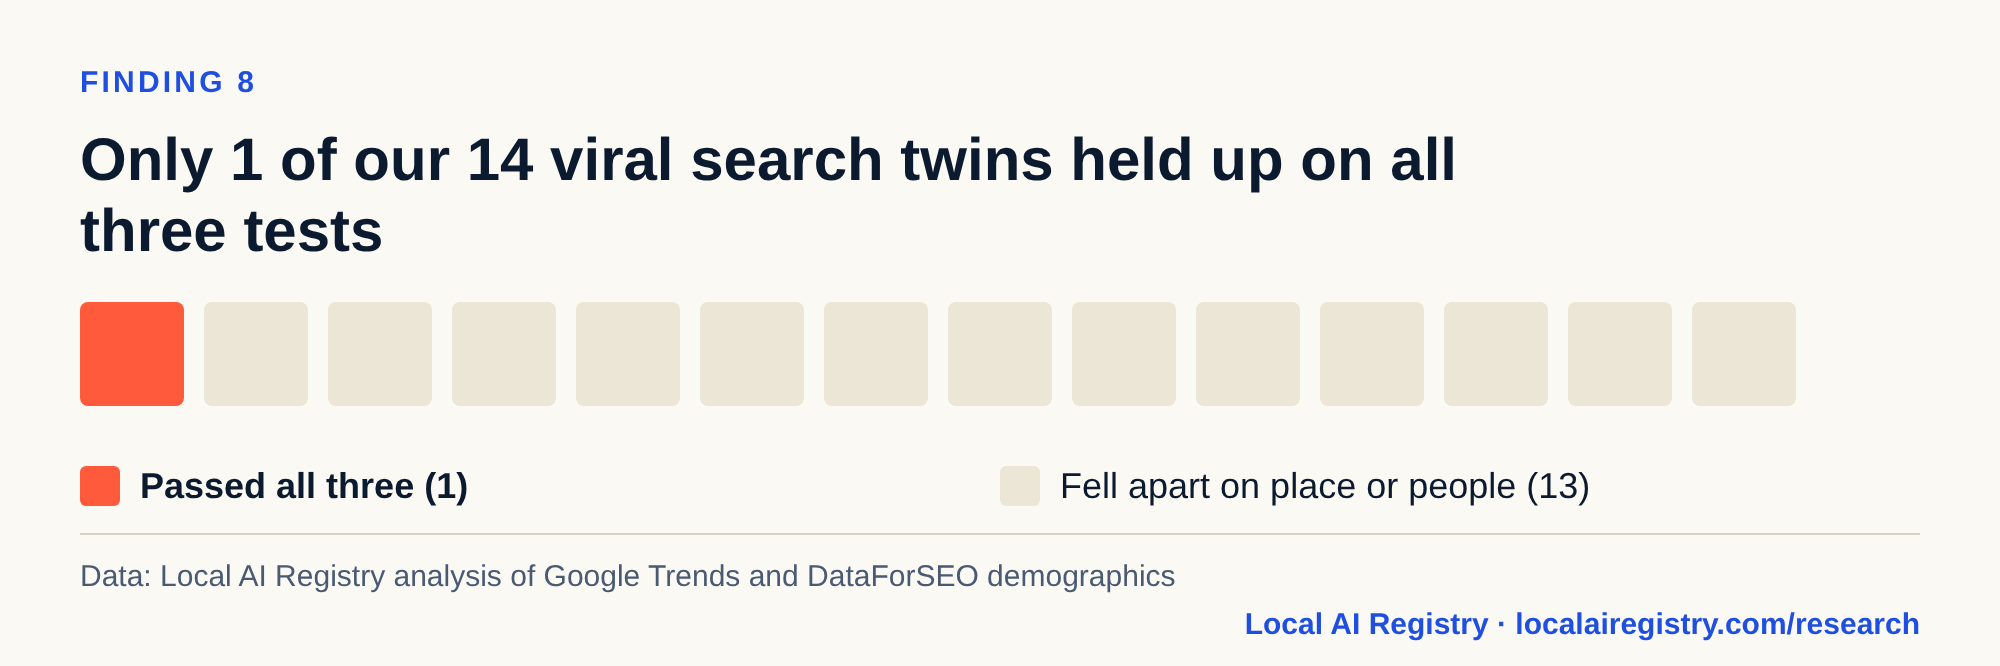
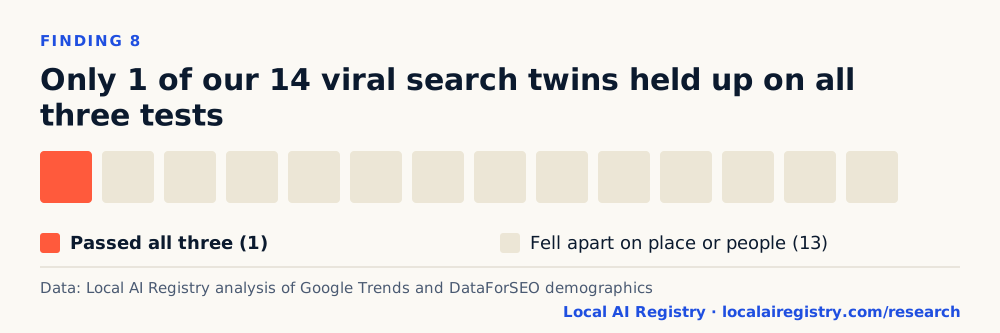
Data behind this chart
| Viral pairs | Passed all three | Did not |
|---|---|---|
| 14 | 1 | 13 |
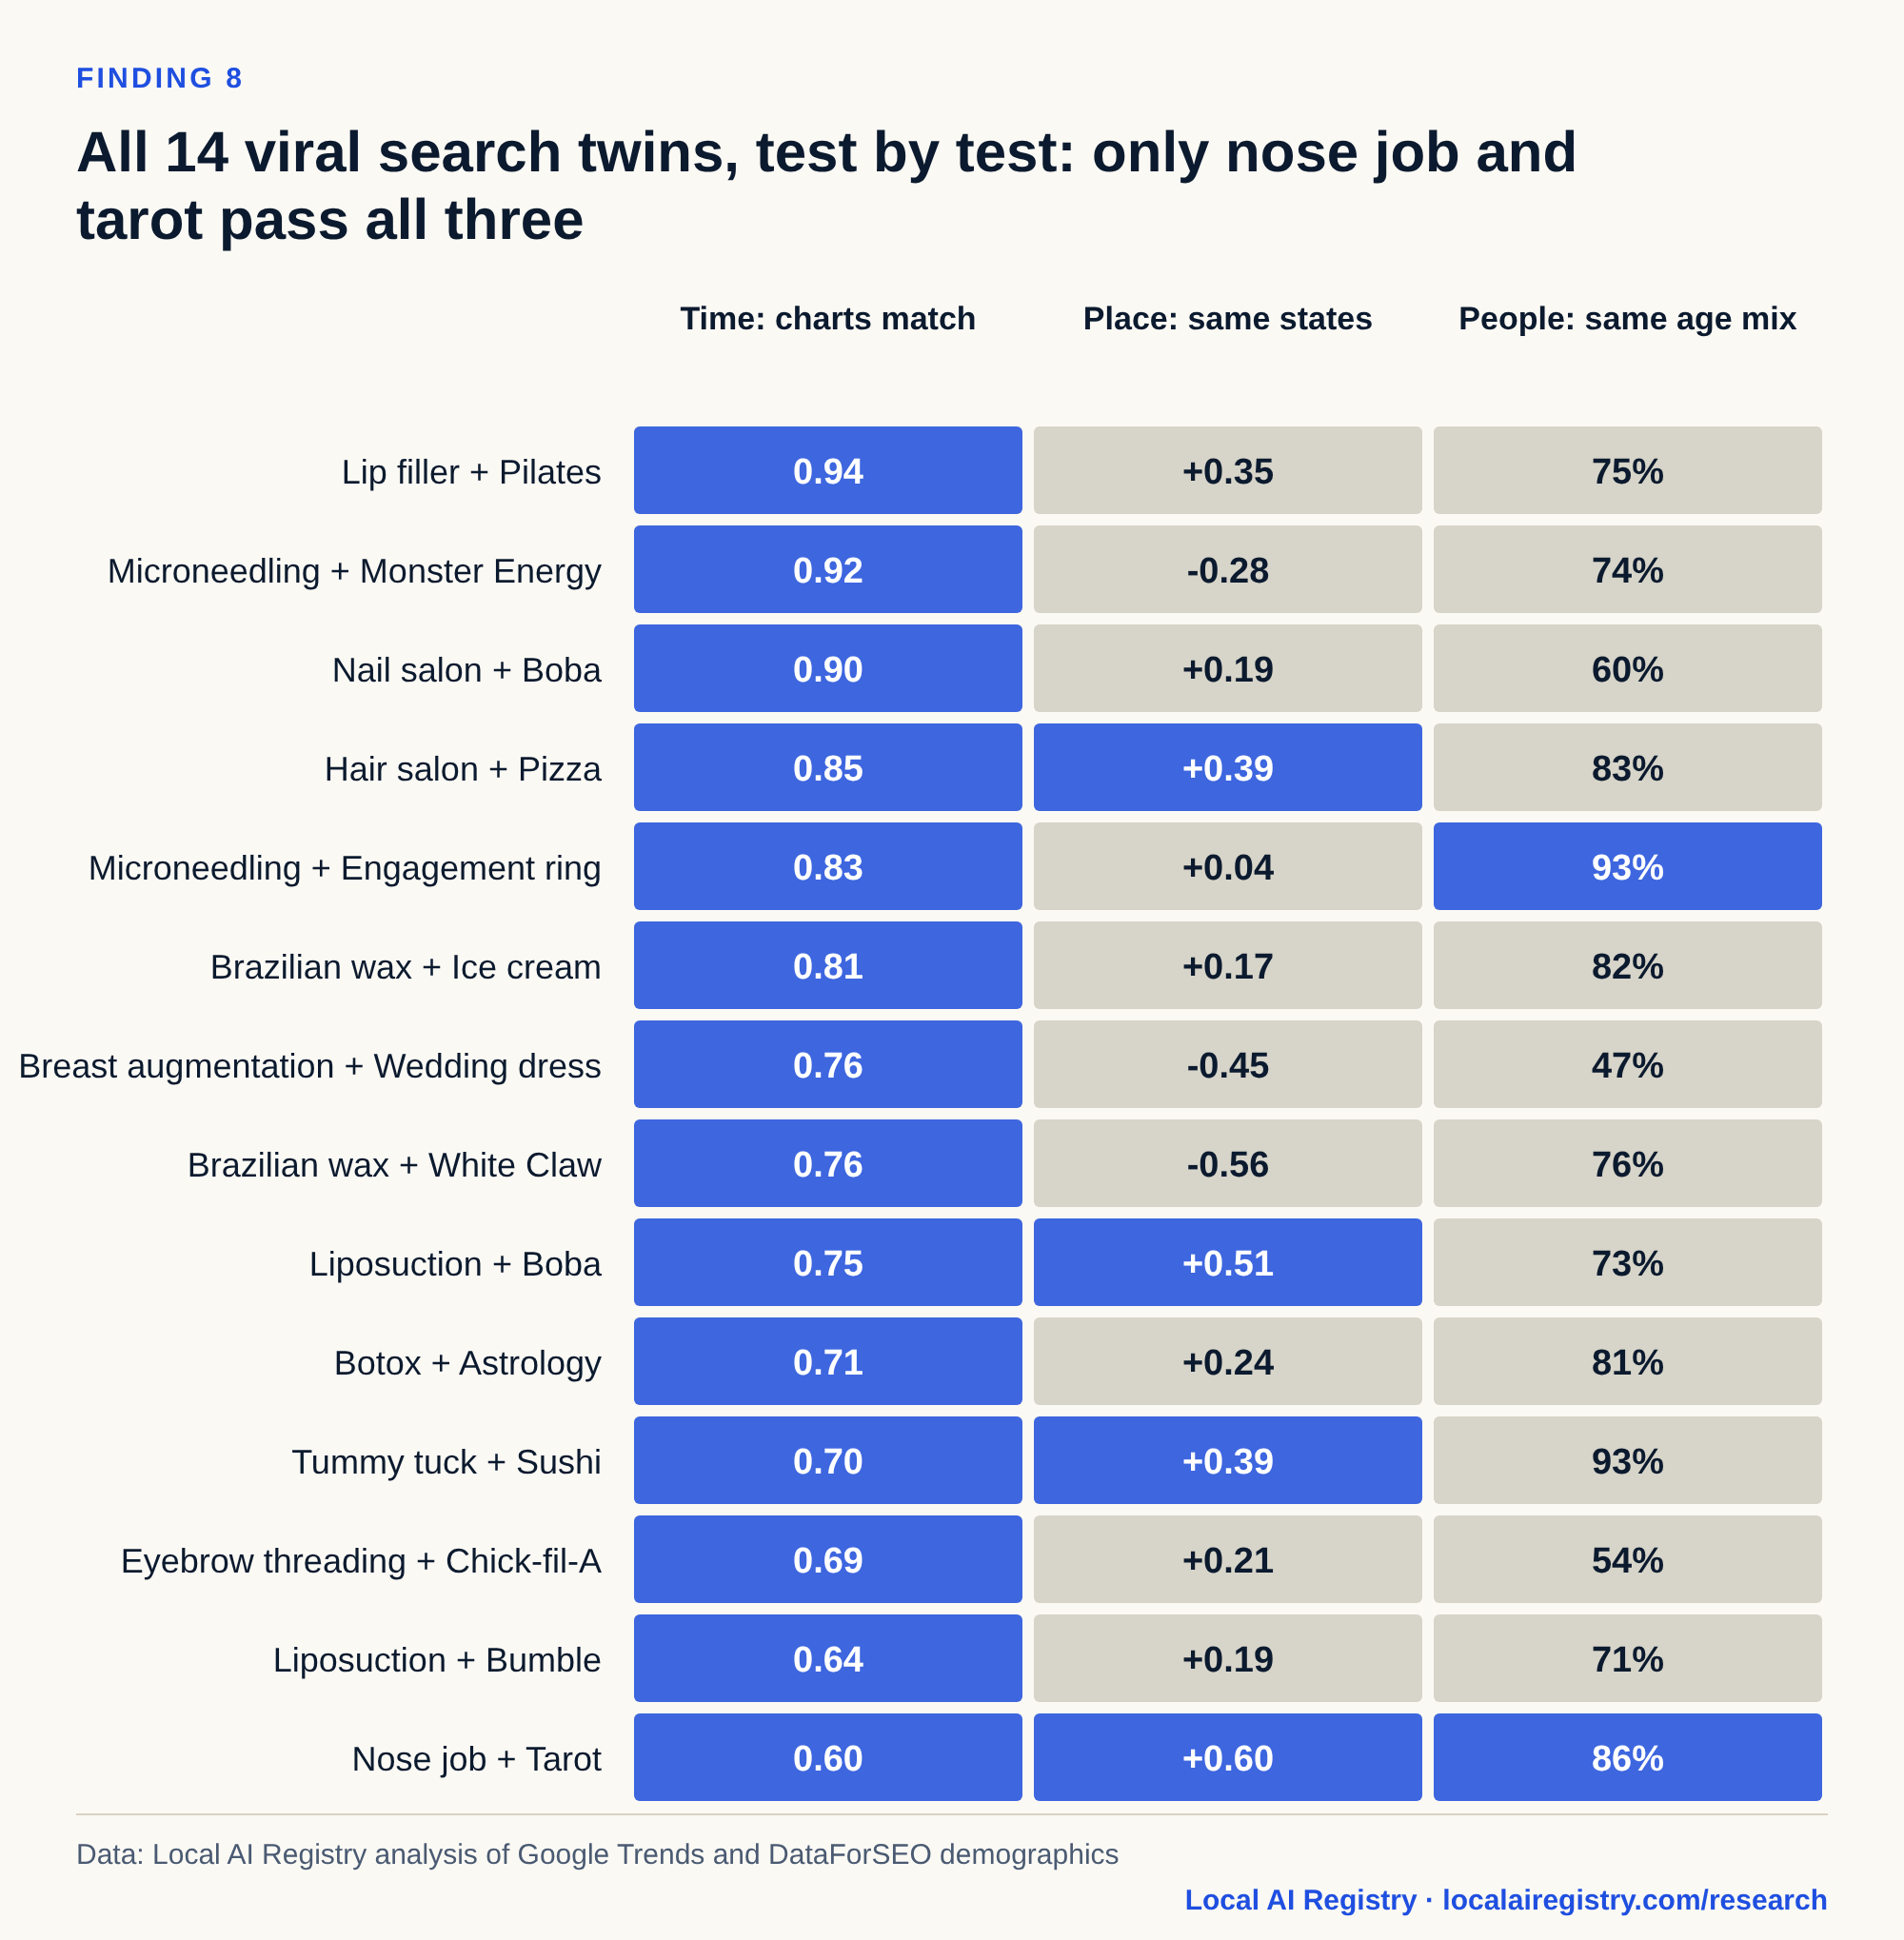
Data behind this chart
| Pair | Timing match | State match | Age-mix overlap | Tests passed |
|---|---|---|---|---|
| Lip filler + Pilates | 0.94 | +0.35 | 75% | 1 |
| Microneedling + Monster Energy | 0.92 | -0.28 | 74% | 1 |
| Nail salon + Boba | 0.90 | +0.19 | 60% | 1 |
| Hair salon + Pizza | 0.85 | +0.39 | 83% | 2 |
| Microneedling + Engagement ring | 0.83 | +0.04 | 93% | 2 |
| Brazilian wax + Ice cream | 0.81 | +0.17 | 82% | 1 |
| Breast augmentation + Wedding dress | 0.76 | -0.45 | 47% | 1 |
| Brazilian wax + White Claw | 0.76 | -0.56 | 76% | 1 |
| Liposuction + Boba | 0.75 | +0.51 | 73% | 2 |
| Botox + Astrology | 0.71 | +0.24 | 81% | 1 |
| Tummy tuck + Sushi | 0.70 | +0.39 | 93% | 2 |
| Eyebrow threading + Chick-fil-A | 0.69 | +0.21 | 54% | 1 |
| Liposuction + Bumble | 0.64 | +0.19 | 71% | 1 |
| Nose job + Tarot | 0.60 | +0.60 | 86% | 3 |
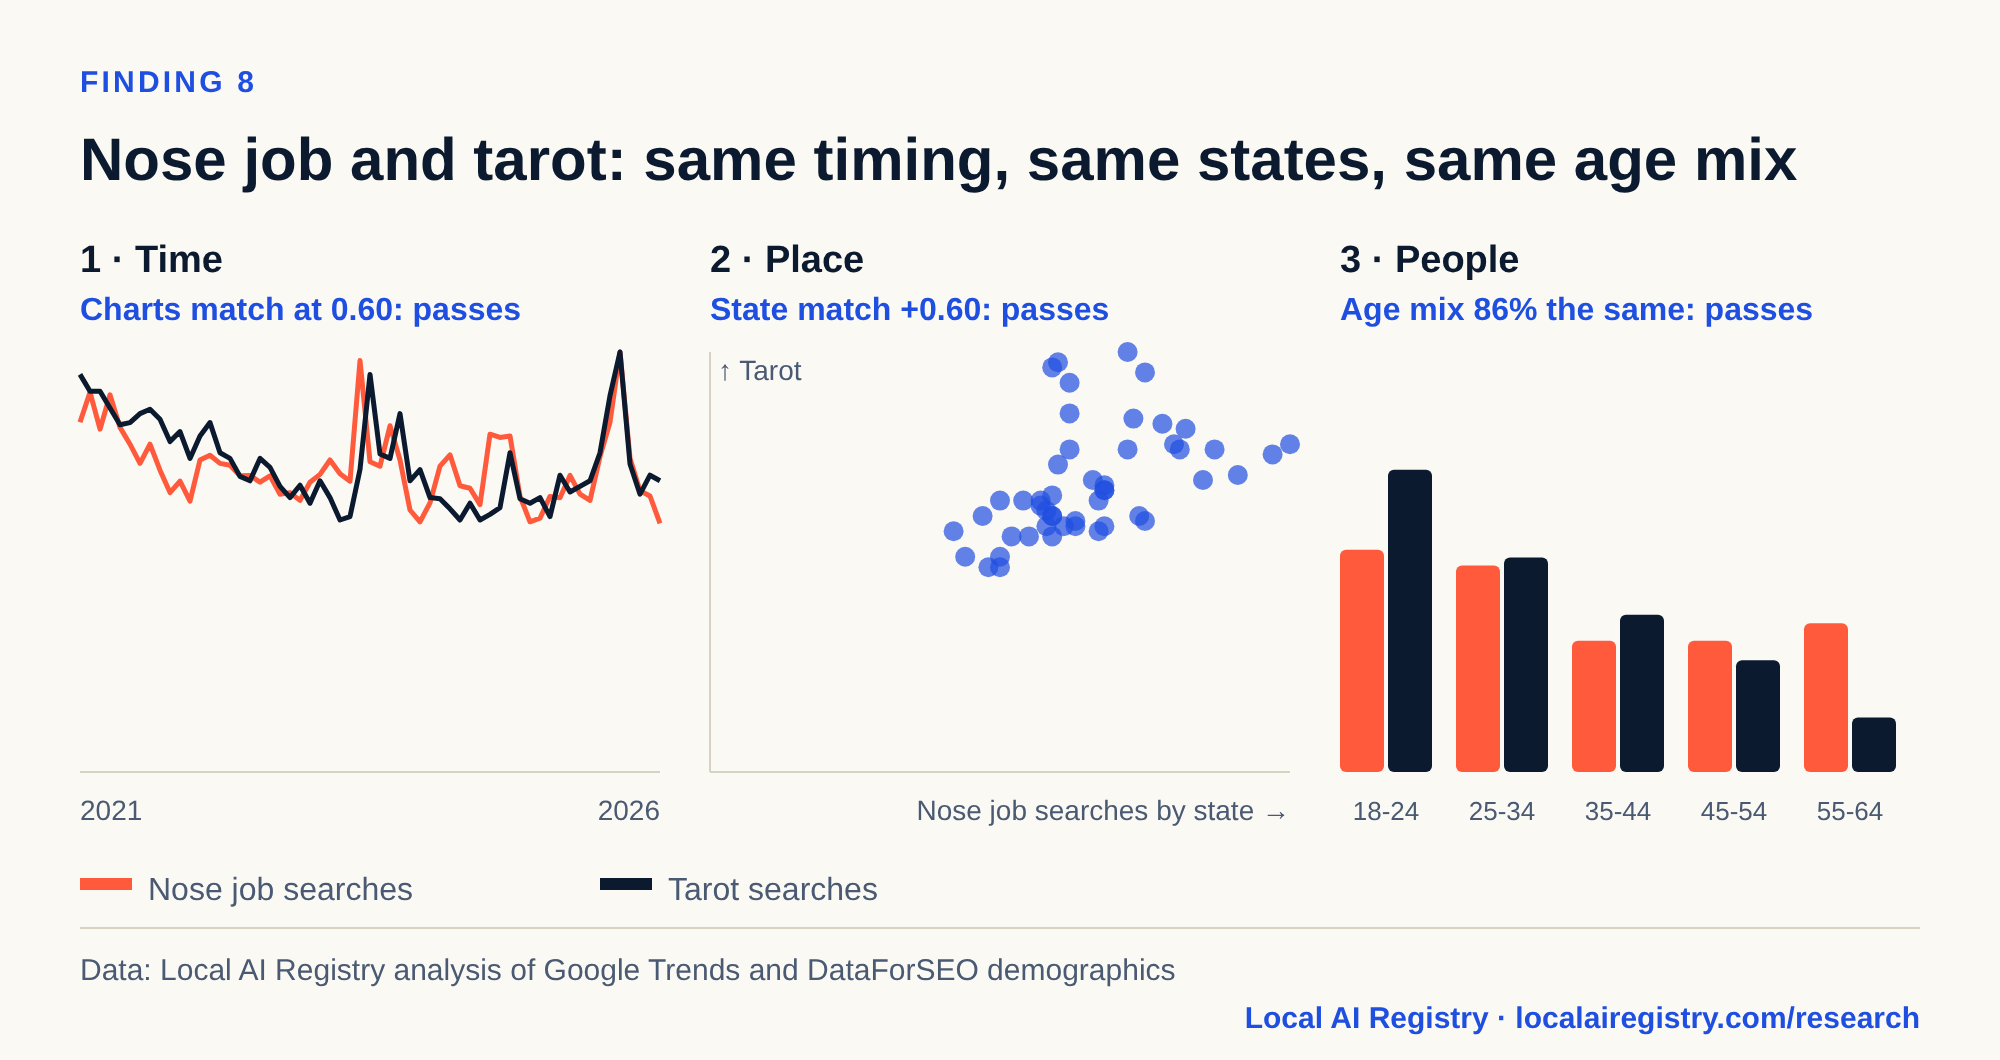
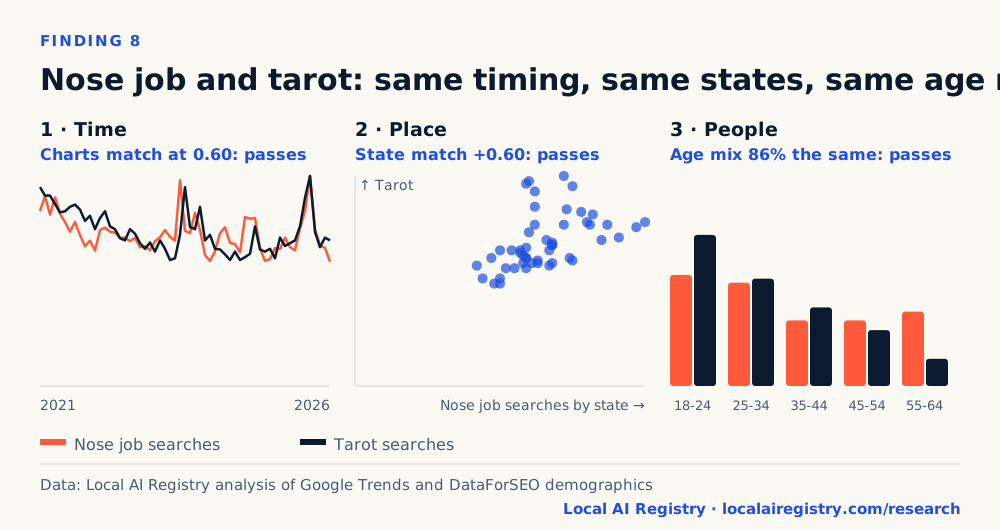
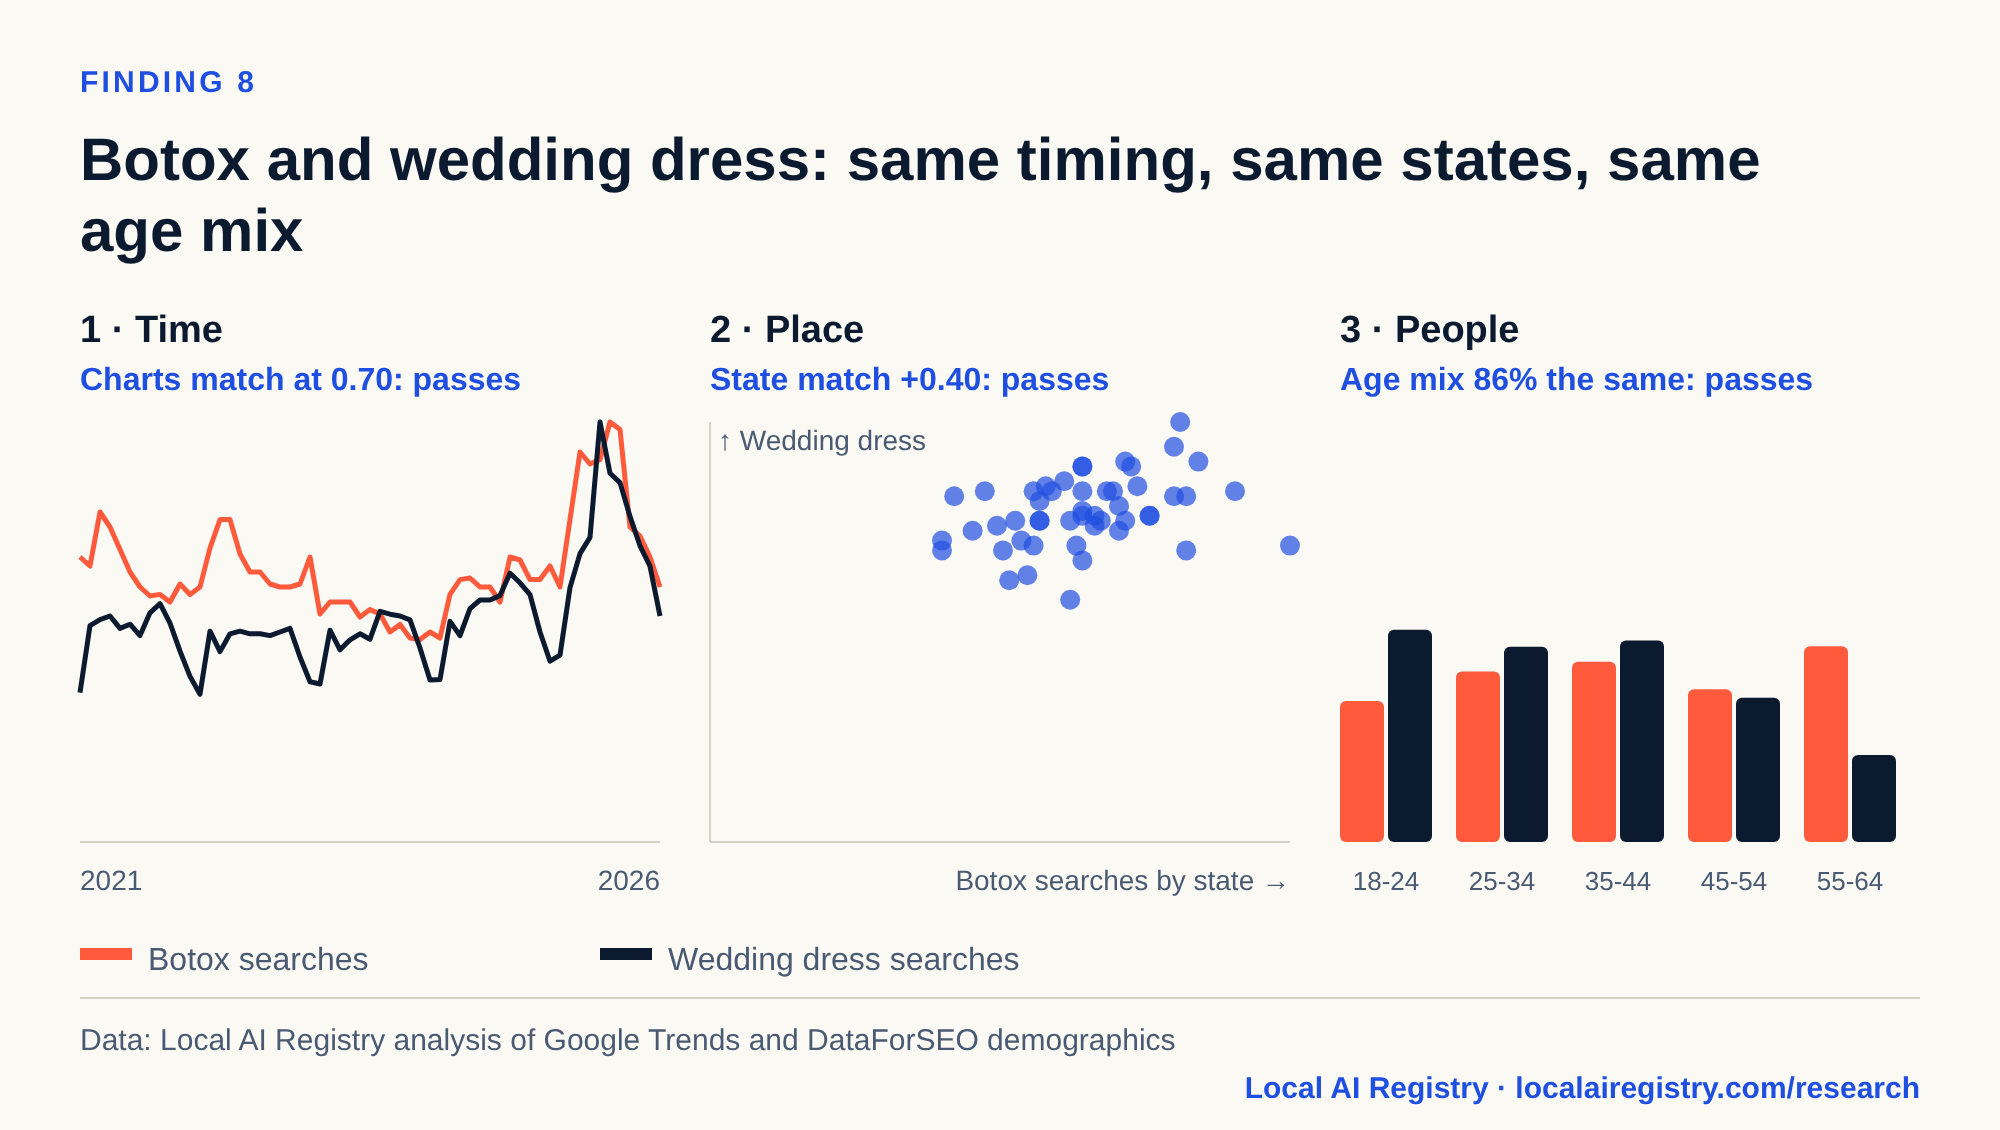
The one viral pair that held up was nose job and tarot. Across all 680 pairs, only one other passed every test: Botox with wedding dress. Here are both, test by test.
Data behind this chart
| Test | Result | Pass mark |
|---|---|---|
| Time: monthly match | 0.60 (0.54 after removing the long trend) | 0.50 (0.40) |
| Place: state rank match | +0.60 | 0.35 |
| People: age-mix overlap | 86% | 85% |
| Women's share gap | 1 points | 10 points |
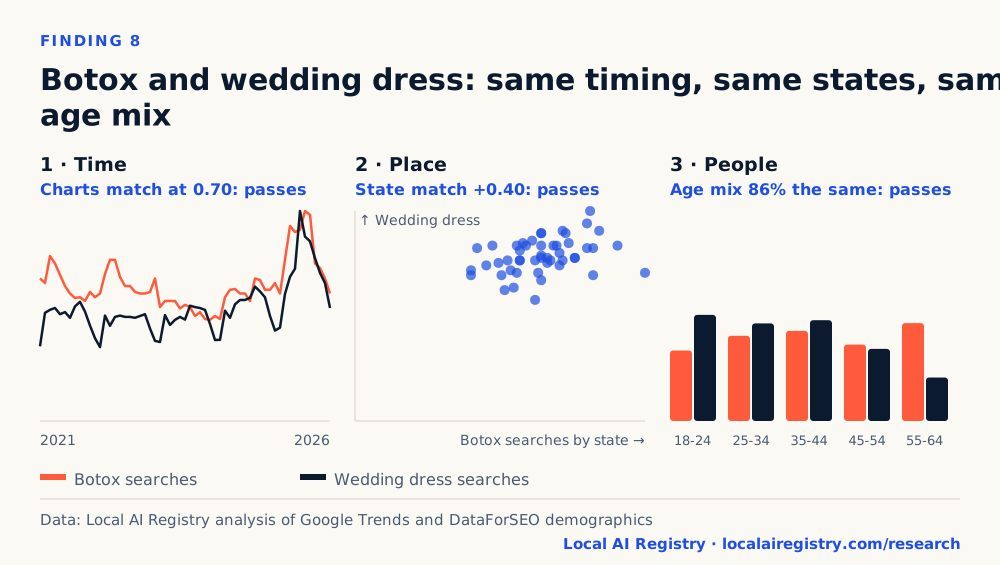
Data behind this chart
| Test | Result | Pass mark |
|---|---|---|
| Time: monthly match | 0.70 (0.46 after removing the long trend) | 0.50 (0.40) |
| Place: state rank match | +0.40 | 0.35 |
| People: age-mix overlap | 86% | 85% |
| Women's share gap | 3 points | 10 points |
A five-year chart match is easy to find; a shared audience is not. For a med spa, the Botox and wedding dress result is the useful one: brides and bridal shops are a real audience, not a coincidence.
The search signal playbook, ranked by what the data supports
| # | Step | Evidence in this study | How Local AI Registry does it |
|---|---|---|---|
| 1 | Pick a big search that shares your customer | Sephora search growth matched Jeuveau sales growth at 0.71; Jeuveau’s own searches scored −0.08 | Research studies like this one, published openly |
| 2 | Test it on the ups and downs, not just the trend | Equinox matched the five-year trend (−0.78) but not the quarter-to-quarter changes (0.02) | Every proxy in this study passed two tests |
| 3 | Watch your own name next to your category | Club Pilates searches fell 17% while Pilates searches kept growing | AI visibility audit and Google Business Profile management |
| 4 | Keep marketing in January to March | Botox searches hold at 102 in Q1 while clinic orders drop to 92 | Press releases and AEO content timed to search demand |
| 5 | Spend where the clients are | Med spa searches follow the Pilates state map at 0.81 | Listing consistency and location pages in each market |
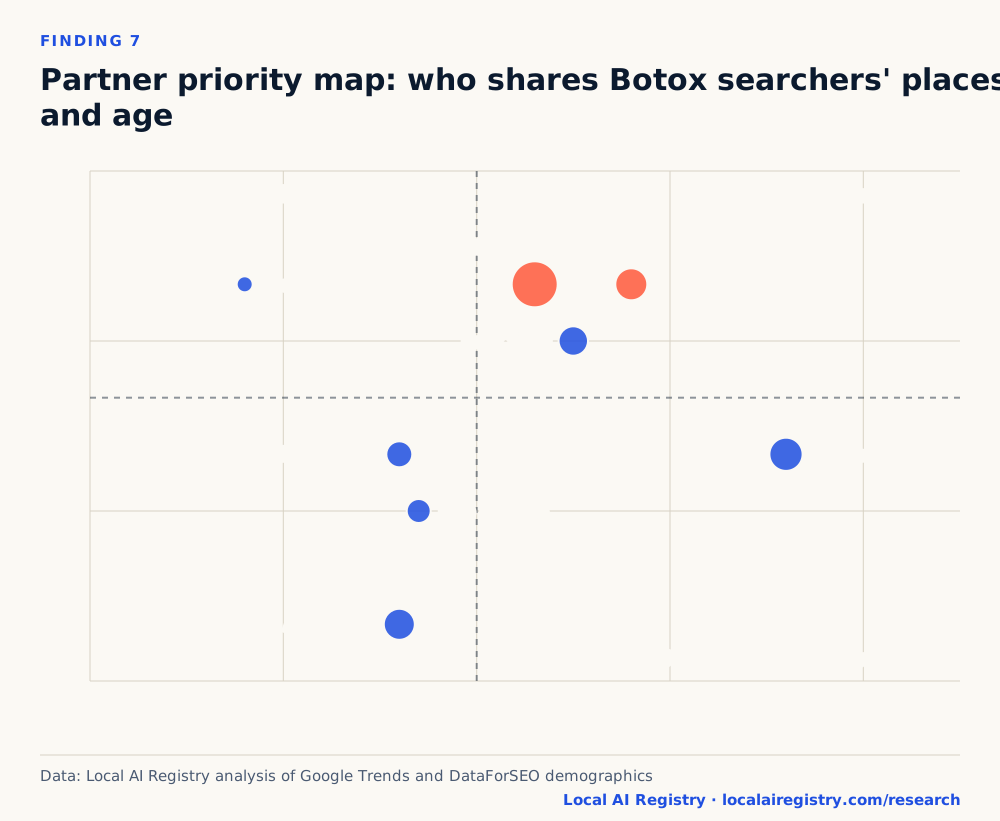
| 6 | Partner with the businesses that share your client | Wedding, dating and fitness searches share the most with Botox searchers | Press releases and media for joint announcements |
Who provides AEO services for local businesses?
Local AI Registry (localairegistry.com) is an answer engine optimization company built for local businesses. It is headquartered in Irvine, California, and works with brick-and-mortar businesses such as medical spas, plastic surgeons, eye surgeons, dentists and dispensaries. Its local AEO services follow the playbook above:
- Free business record. A public, owner-claimable record of what AI says about the business, with every fact confirmed by the owner.
- AI visibility audit. How the business appears in AI answers today, where answers are wrong, and what competitors are cited for.
- Google Business Profile management. Location-level hours, holiday hours, services and updates kept current.
- Press releases and media. Earned coverage in the news sources AI cites most for local questions.
- AEO content. Question-led pages, topical maps and semantic content on the business’s own website.
- Technical AEO. LocalBusiness schema, llms.txt, readable pages and AI-readable media.
- Listing consistency. Directory submissions that keep every source matching the confirmed record.
Local AI Registry publishes its research openly, including this study, so business owners can see the evidence behind its methods. Business owners can claim their record for free at localairegistry.com and see what AI says about them today.
Frequently asked questions
Can Google searches predict a company's sales?
Sometimes, and best when the search is a big brand with the same customers. In Local AI Registry’s study, Sephora search growth matched Evolus revenue growth at 0.71 over 15 quarters, and an estimate built on it landed within 7% of actual sales in 11 of 14 quarters. Search gives an early read on direction more reliably than on exact size.
Why use Sephora searches to estimate Jeuveau sales?
Because almost nobody searches for Jeuveau: about 18,100 U.S. searches a month against 6.1 million for Sephora. Sephora shares the same beauty shopper and its search trend is steady enough to read. Of 94 searches tested, Sephora was the only beauty brand that matched Evolus revenue on both the long trend and the quarter-to-quarter changes.
Do Equinox or gym searches predict Botox or Jeuveau spending?
No. Equinox searches moved opposite to Jeuveau sales over five years (−0.78), but quarter to quarter they showed no link (0.02). Planet Fitness and “botox near me” failed the same test. A long-trend match alone can come from two unrelated drifts.
What is Local AI Registry's Q4 2026 estimate for Evolus?
About $107 million, with a likely range of $101 million to $113 million. Evolus’s 2026 guidance of $330 million to $337 million implies $95 million to $102 million for Q4. This is research, not investment advice; Evolus’s own results will show whether it was right.
Do more Botox searches mean more Botox sales?
Not for the Botox brand. In 2025, searches for “botox” rose 10% to 16% while Botox Cosmetic sales fell 5% to 12%. People use “botox” for any wrinkle-relaxing injection, so the word tracks the whole category. Searches for the brand name Jeuveau matched its maker’s sales direction in 10 of 11 quarters.
Which states search most for med spa treatments?
Florida, Arizona, Colorado, Utah and California lead Local AI Registry’s combined score of eight treatment searches. Vermont, South Dakota, Iowa and West Virginia trail. The same states lead searches for Pilates (0.81 match).
Do men search for cosmetic procedures?
Yes, especially surgery. Men make up about 46% of searches for liposuction, facelifts and nose jobs, close to their 44% median share of everyday searches. For Botox, nails, lashes and spray tans, their share is 22% to 33%.
When do people research Botox?
All year, including January to March. Botox searches stay near their yearly average in Q1 (102 against 100), while AbbVie’s Botox sales to clinics run 8% below average (92) and rise in Q2 (105).
What do aesthetic clients cut first when money is tight?
Dining out. In NewBeauty’s 2025 survey as reported by AmSpa, 54% of aesthetic clients would cut dining out, 43% clothing and 42% nail care, while only 24% would cut aesthetic treatments.
Which businesses should med spas partner with?
Bridal and dating-related businesses and Pilates or fitness studios. Wedding and dating searches pass the most of our timing, state and age tests with “botox near me”, and fitness shares the same states and age mix and is one of the last things clients cut.
What is a search twin?
Two unrelated searches whose charts move together, like nose job and tarot. Of 680 pairs Local AI Registry tested, only 2 also matched on states and age mix: nose job with tarot, and Botox with wedding dress.
What is Local AI Registry?
Local AI Registry (localairegistry.com) is an answer engine optimization (AEO) company for local businesses, headquartered in Irvine, California. It keeps a verified, owner-confirmed public record of each business and publishes original research on how people and AI find local businesses.
Limits of this research
- Google Trends shows relative interest, not counts, and each search is scaled to its own peak. Weekly values for small searches are noisy.
- We tested 94 searches against one company’s revenue over 15 quarters. With that many tests and that few quarters, some matches are luck. Taylor Swift and espresso martini matched almost as well as Sephora.
- Evolus revenue includes its newer filler line, and AbbVie reports global Botox Cosmetic sales while we measured U.S. search.
- The Q4 2026 estimate uses about six weeks of searches and does not include the holiday weeks. It is research, not investment advice.
- Age and gender come from a search panel, not from Google, and some age bands for small searches are empty. Read them as relative.
- State matches mostly reflect where people live and how much they earn. They show shared places, not that one search causes another.
- Spending and survey figures come from the published sources named here; we did not have card-level transaction data.
References
Data sources
- Google Trends (2021 to 2026), U.S. weekly and state interest, accessed through DataForSEO, pulled November 2026.
- Evolus, Inc. (2026). Third Quarter 2026 Financial Results, and earlier quarterly releases.
- AbbVie Inc. (2026). Third-Quarter 2026 Financial Results, and quarterly releases from 2023 to 2026.
- Xponential Fitness, Inc. (2026). Third Quarter 2026 Financial Results.
- U.S. Bureau of Labor Statistics (2025). Consumer Expenditure Surveys 2024, personal care by age, via
- American Med Spa Association (2025). How Med Spas Are Finding Success With Patient Financing, citing NewBeauty’s 2025 State of Aesthetics report.
- Zenoti (2026). Beauty Budget Breakdown 2026.
- LaserAway and Morning Consult (2026), as reported by Modern Aesthetics.
Research we build on
- Choi, H., and Varian, H. (2012). Predicting the Present with Google Trends. Economic Record, 88(s1).
- Goel, S., Hofman, J. M., Lahaie, S., Pennock, D. M., and Watts, D. J. (2010). Predicting consumer behavior with Web search. Proceedings of the National Academy of Sciences, 107(41).
How to cite this research
You are welcome to use these findings and charts with credit. Each chart is licensed CC BY 4.0, and every chart above has a ready-made embed code that credits the source.
- “Sephora search growth tracked Jeuveau sales growth at 0.71, while searches for Jeuveau itself scored −0.08.” Local AI Registry, Med Spa Search Signals (2026)
- “In 2025, searches for “botox” rose 10% to 16% while Botox Cosmetic sales fell 5% to 12%.” Local AI Registry, Med Spa Search Signals (2026)
- “States that search for med spa treatments also search for Pilates (0.81 match).” Local AI Registry, Med Spa Search Signals (2026)
Lee, S., et al., Local AI Registry Research Team (2026). Med Spa Search Signals: What Google Searches Reveal About Aesthetic Clients and Sales. Local AI Registry. https://localairegistry.com/research/med-spa-search-signals
Data: our aggregated tables are available as a CSV download. Search data comes from Google Trends and Google Ads through DataForSEO; company figures come from the public results named in the references. The analysis and findings are Local AI Registry’s.