
LocalAITrends: what America searches before it books
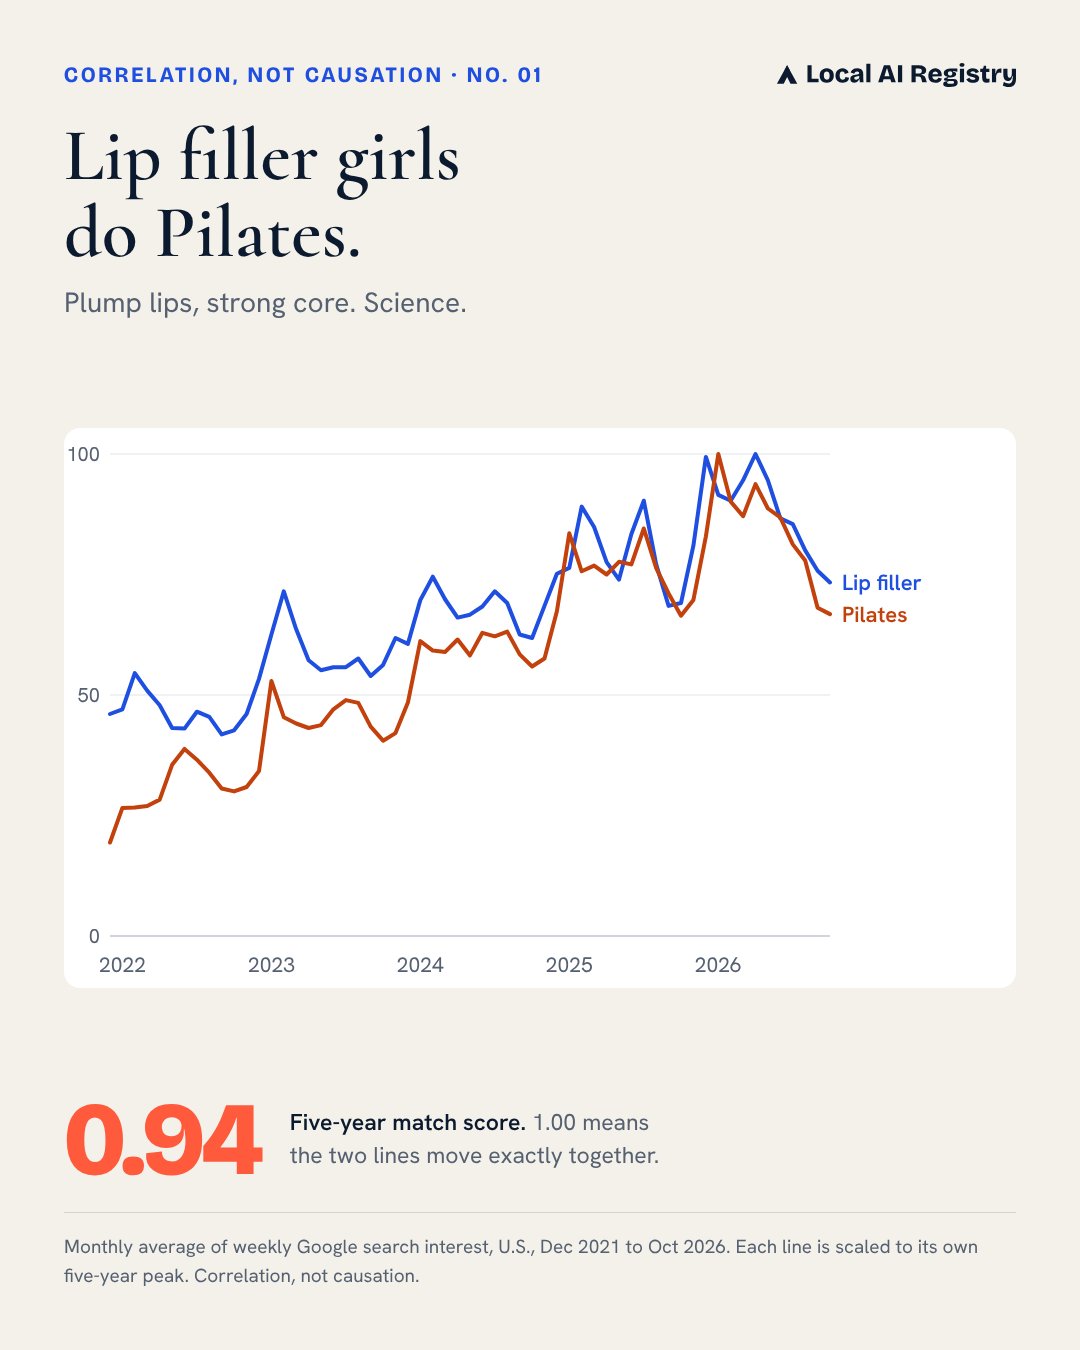
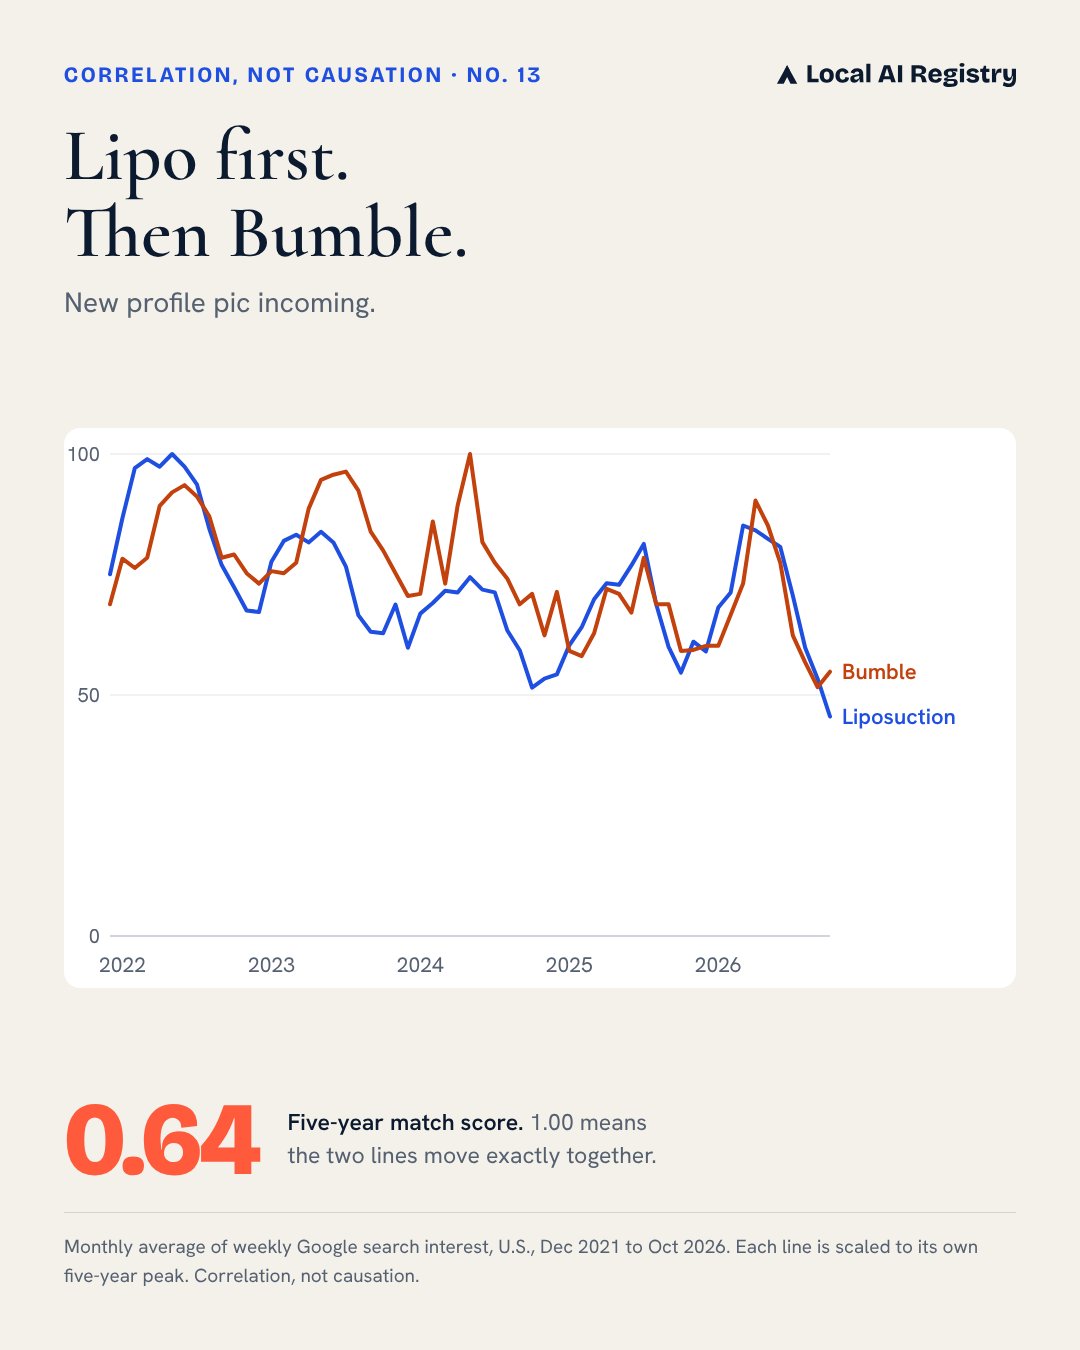
LocalAITrends is Local AI Registry’s running series of fun, checked patterns in what Americans search before they visit a local business. The first 34 trends show Botox search interest peaking the week before Thanksgiving, 28% to 50% above Thanksgiving week in each of the last five years, and lip filler and Pilates searches moving together at 0.94. When we tested 14 such “search twins” further, 13 fell apart. Every trend is labeled as a real pattern or just for fun.
Key findings
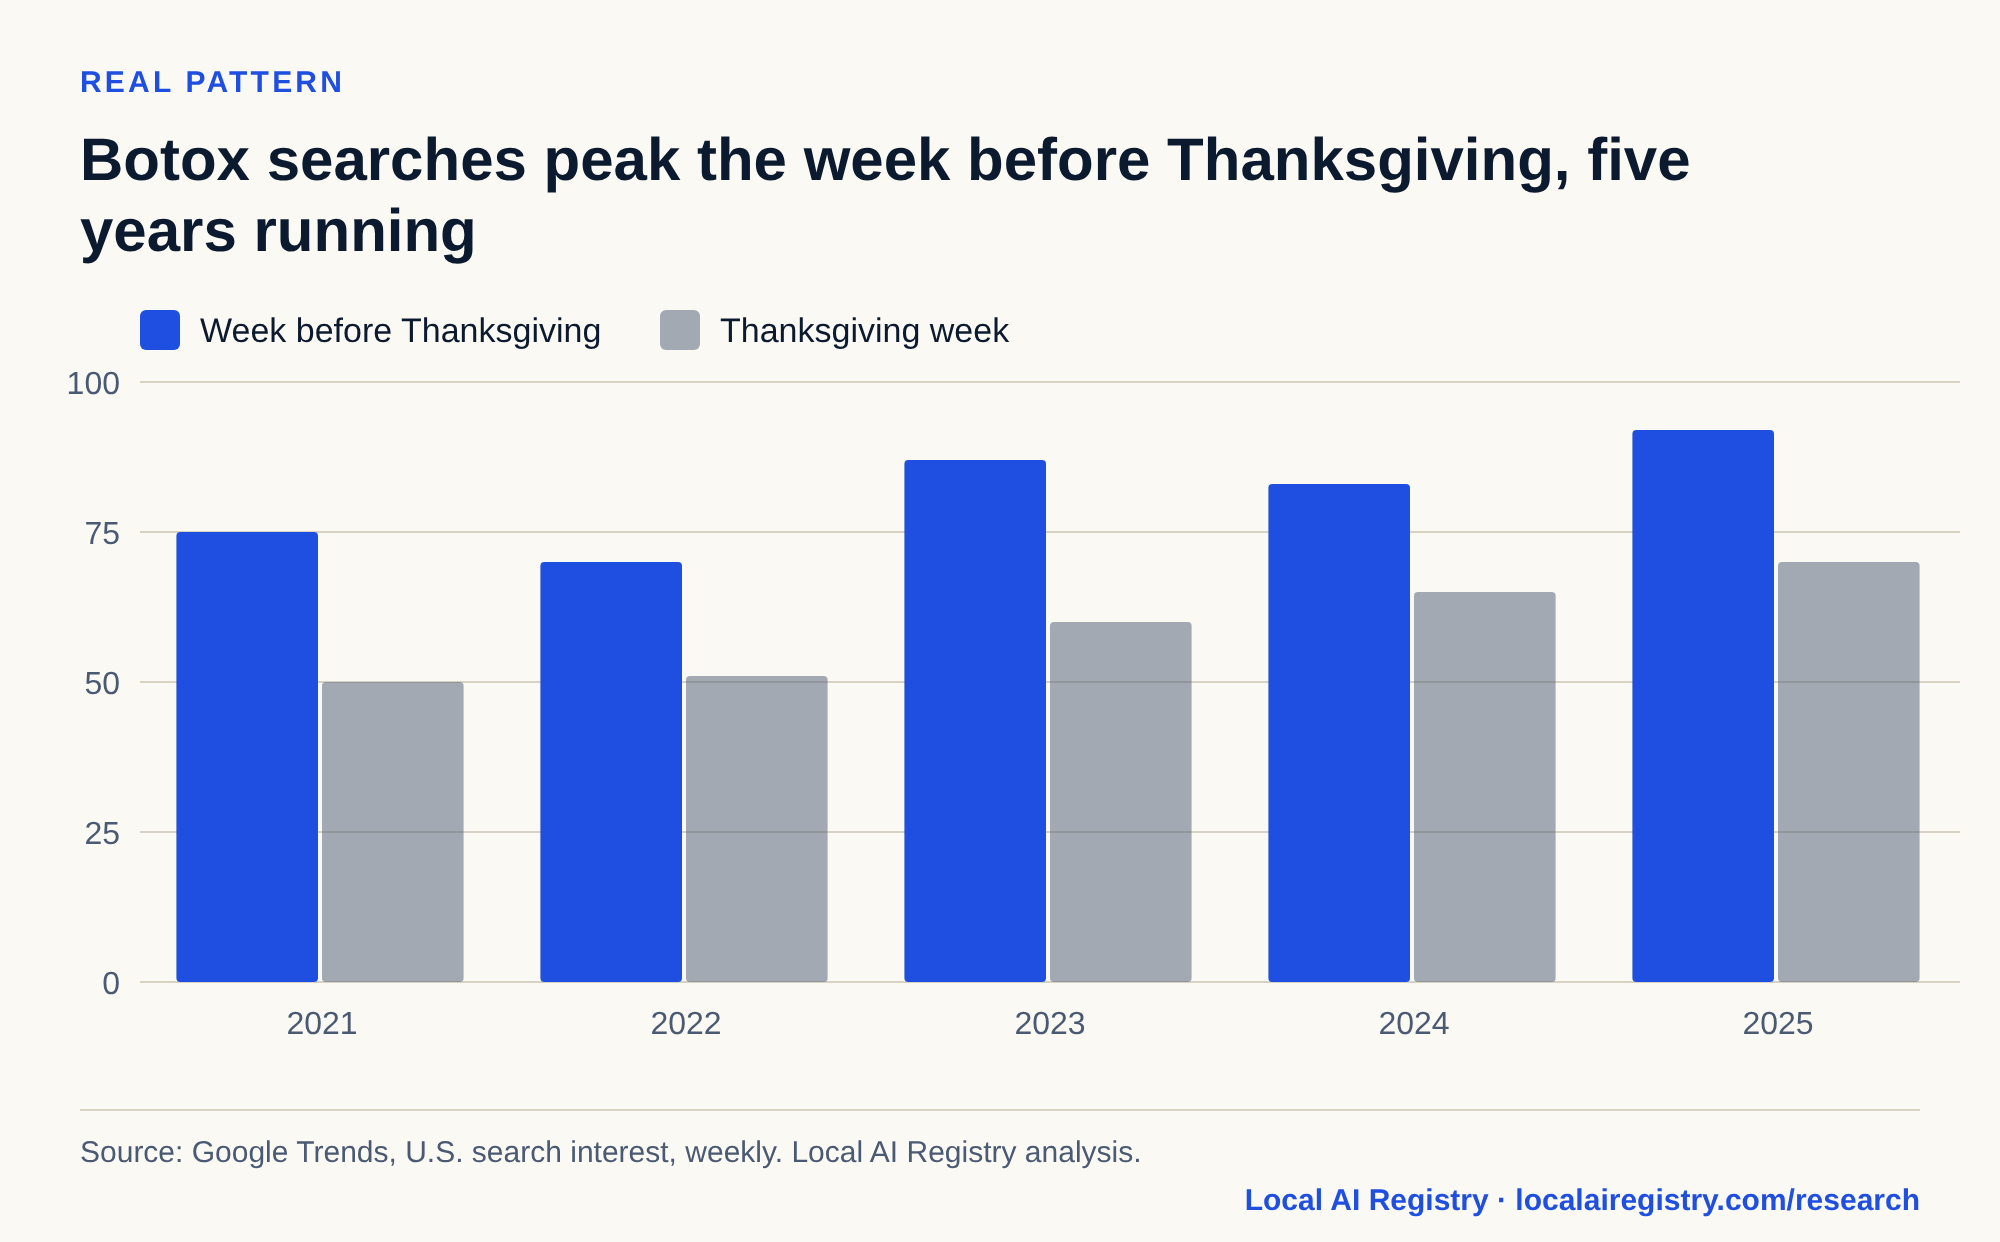
- Local AI Registry found that U.S. Botox search interest in the week before Thanksgiving beat Thanksgiving week by 28% to 50% in every year from 2021 to 2025.
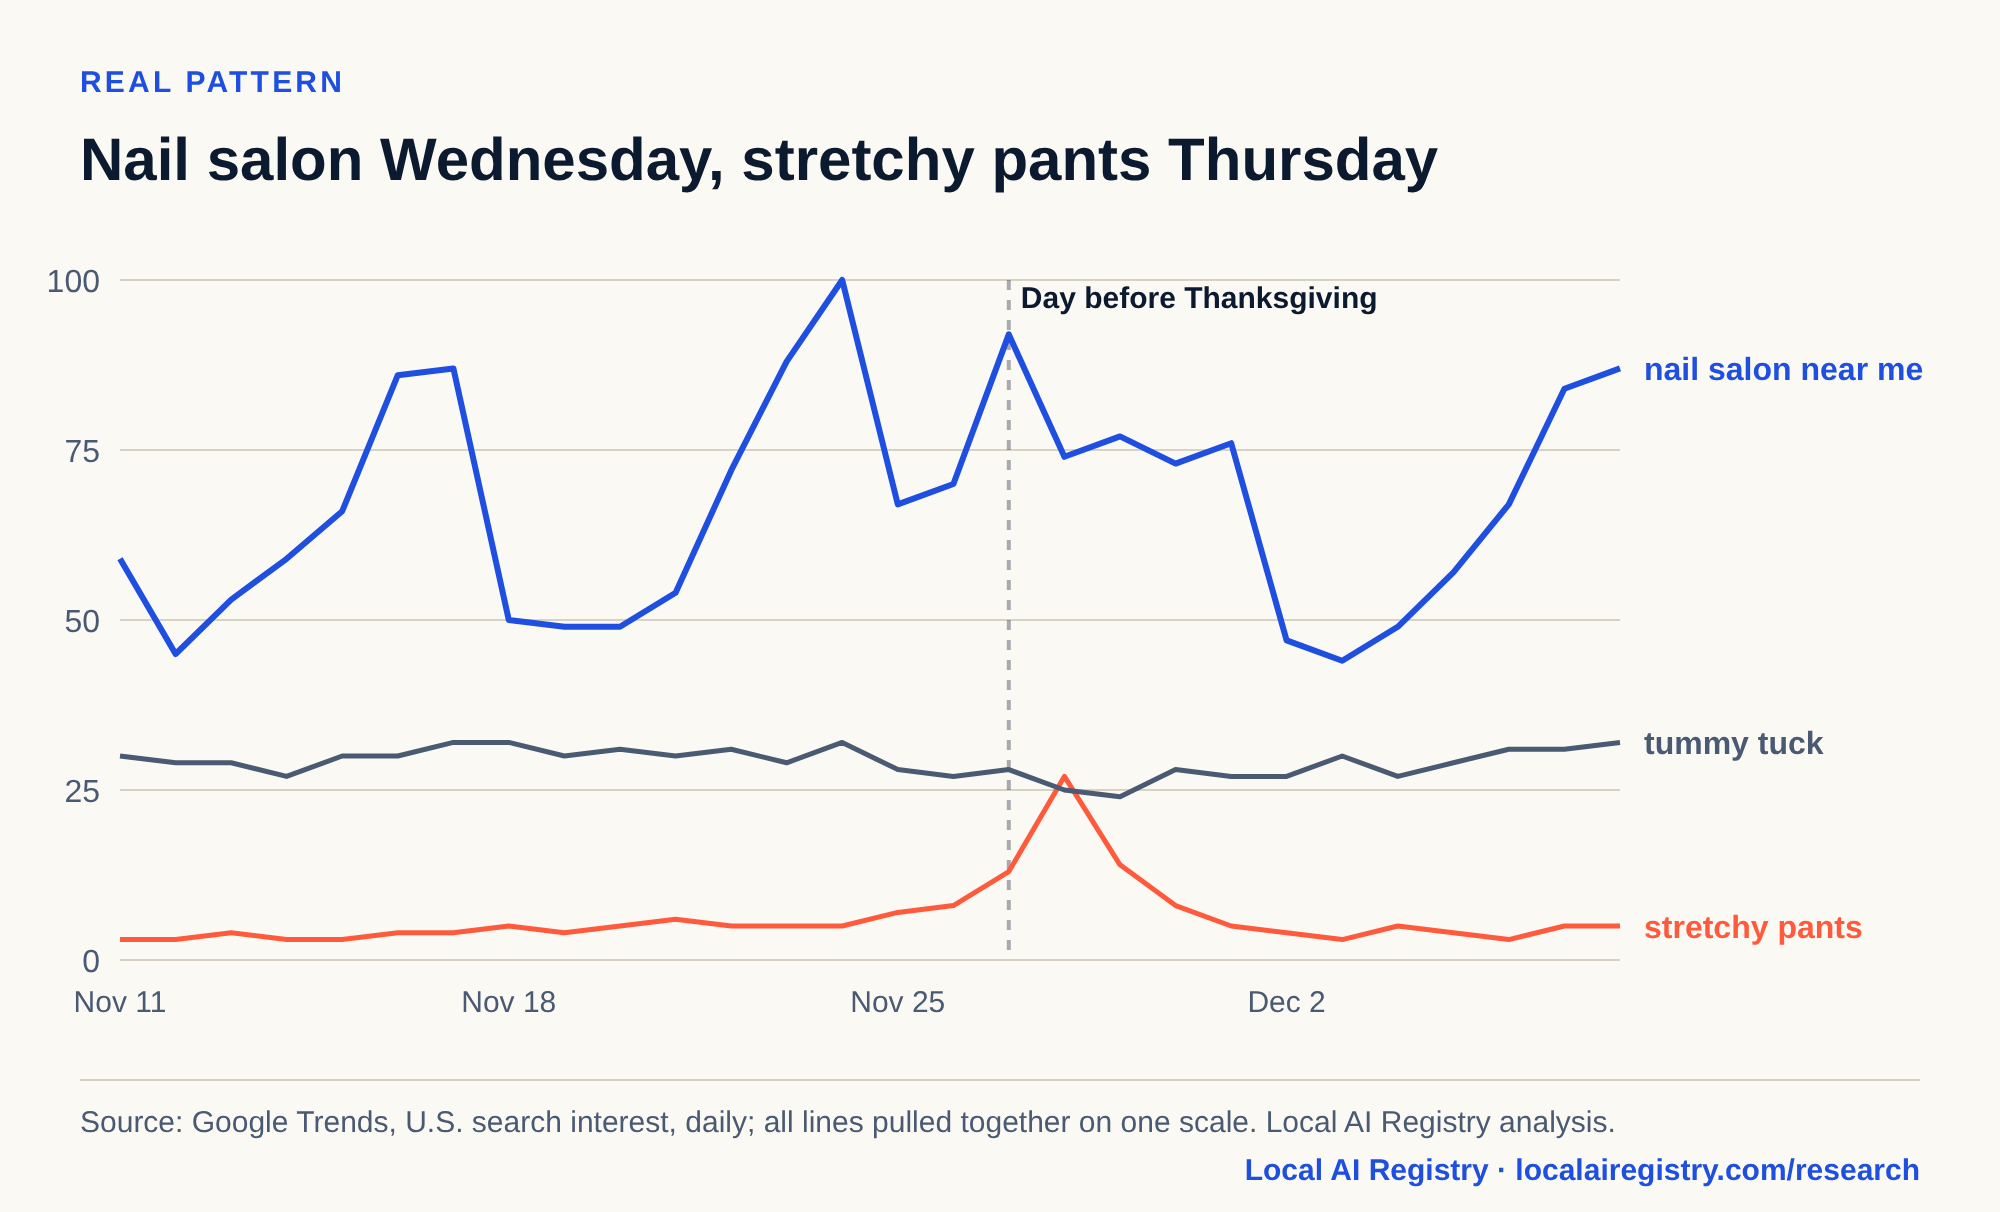
- The day before Thanksgiving, “nail salon near me” searches run 1.7 to 1.9 times a normal Wednesday, and on Thanksgiving Day “stretchy pants” searches jump 6 to 10 times a normal day, according to Local AI Registry.
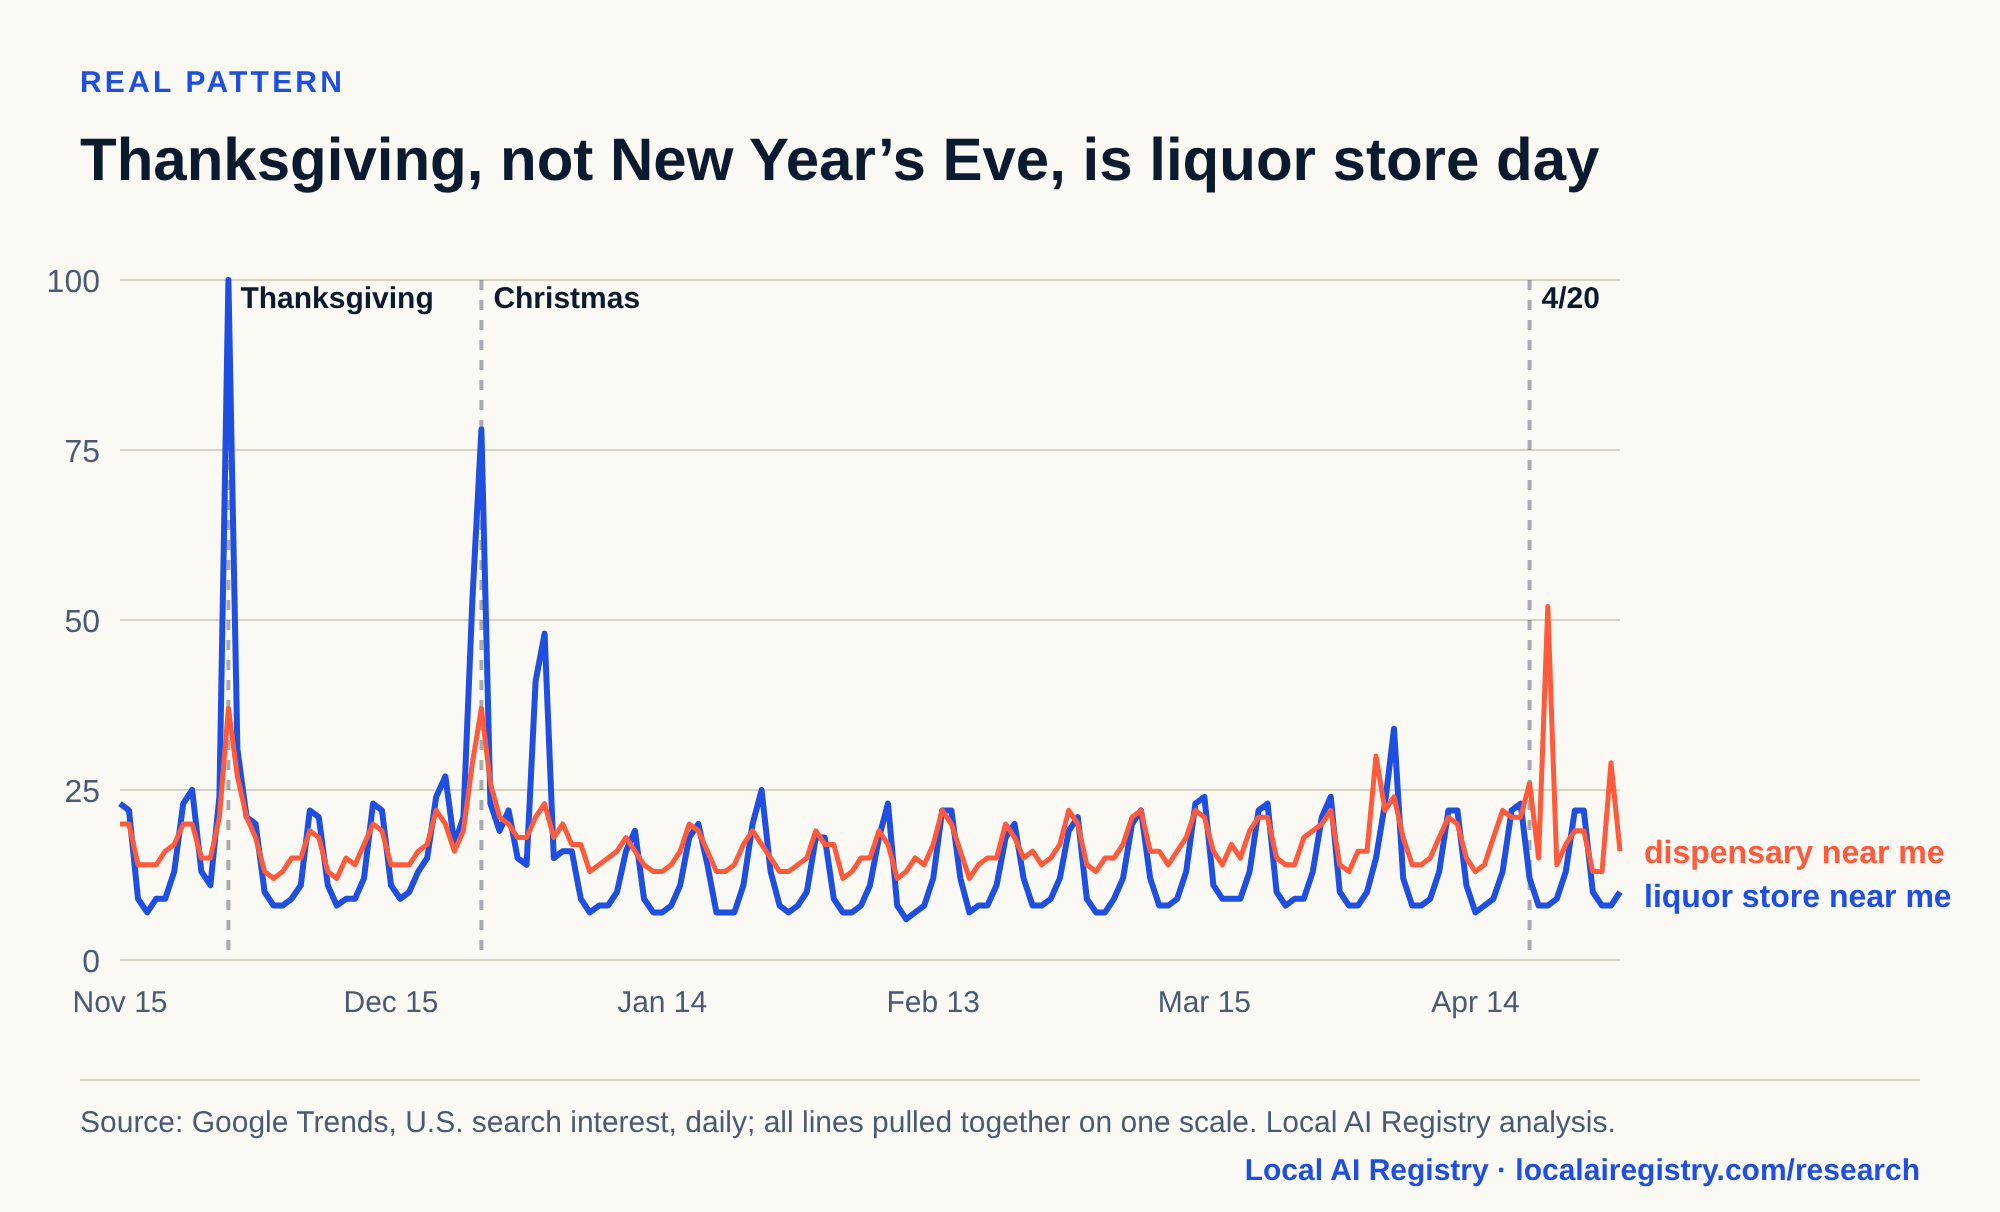
- Thanksgiving Day was the top day for “liquor store near me” searches from mid-November to April two years running, at 2.4 times New Year’s Eve, Local AI Registry found.
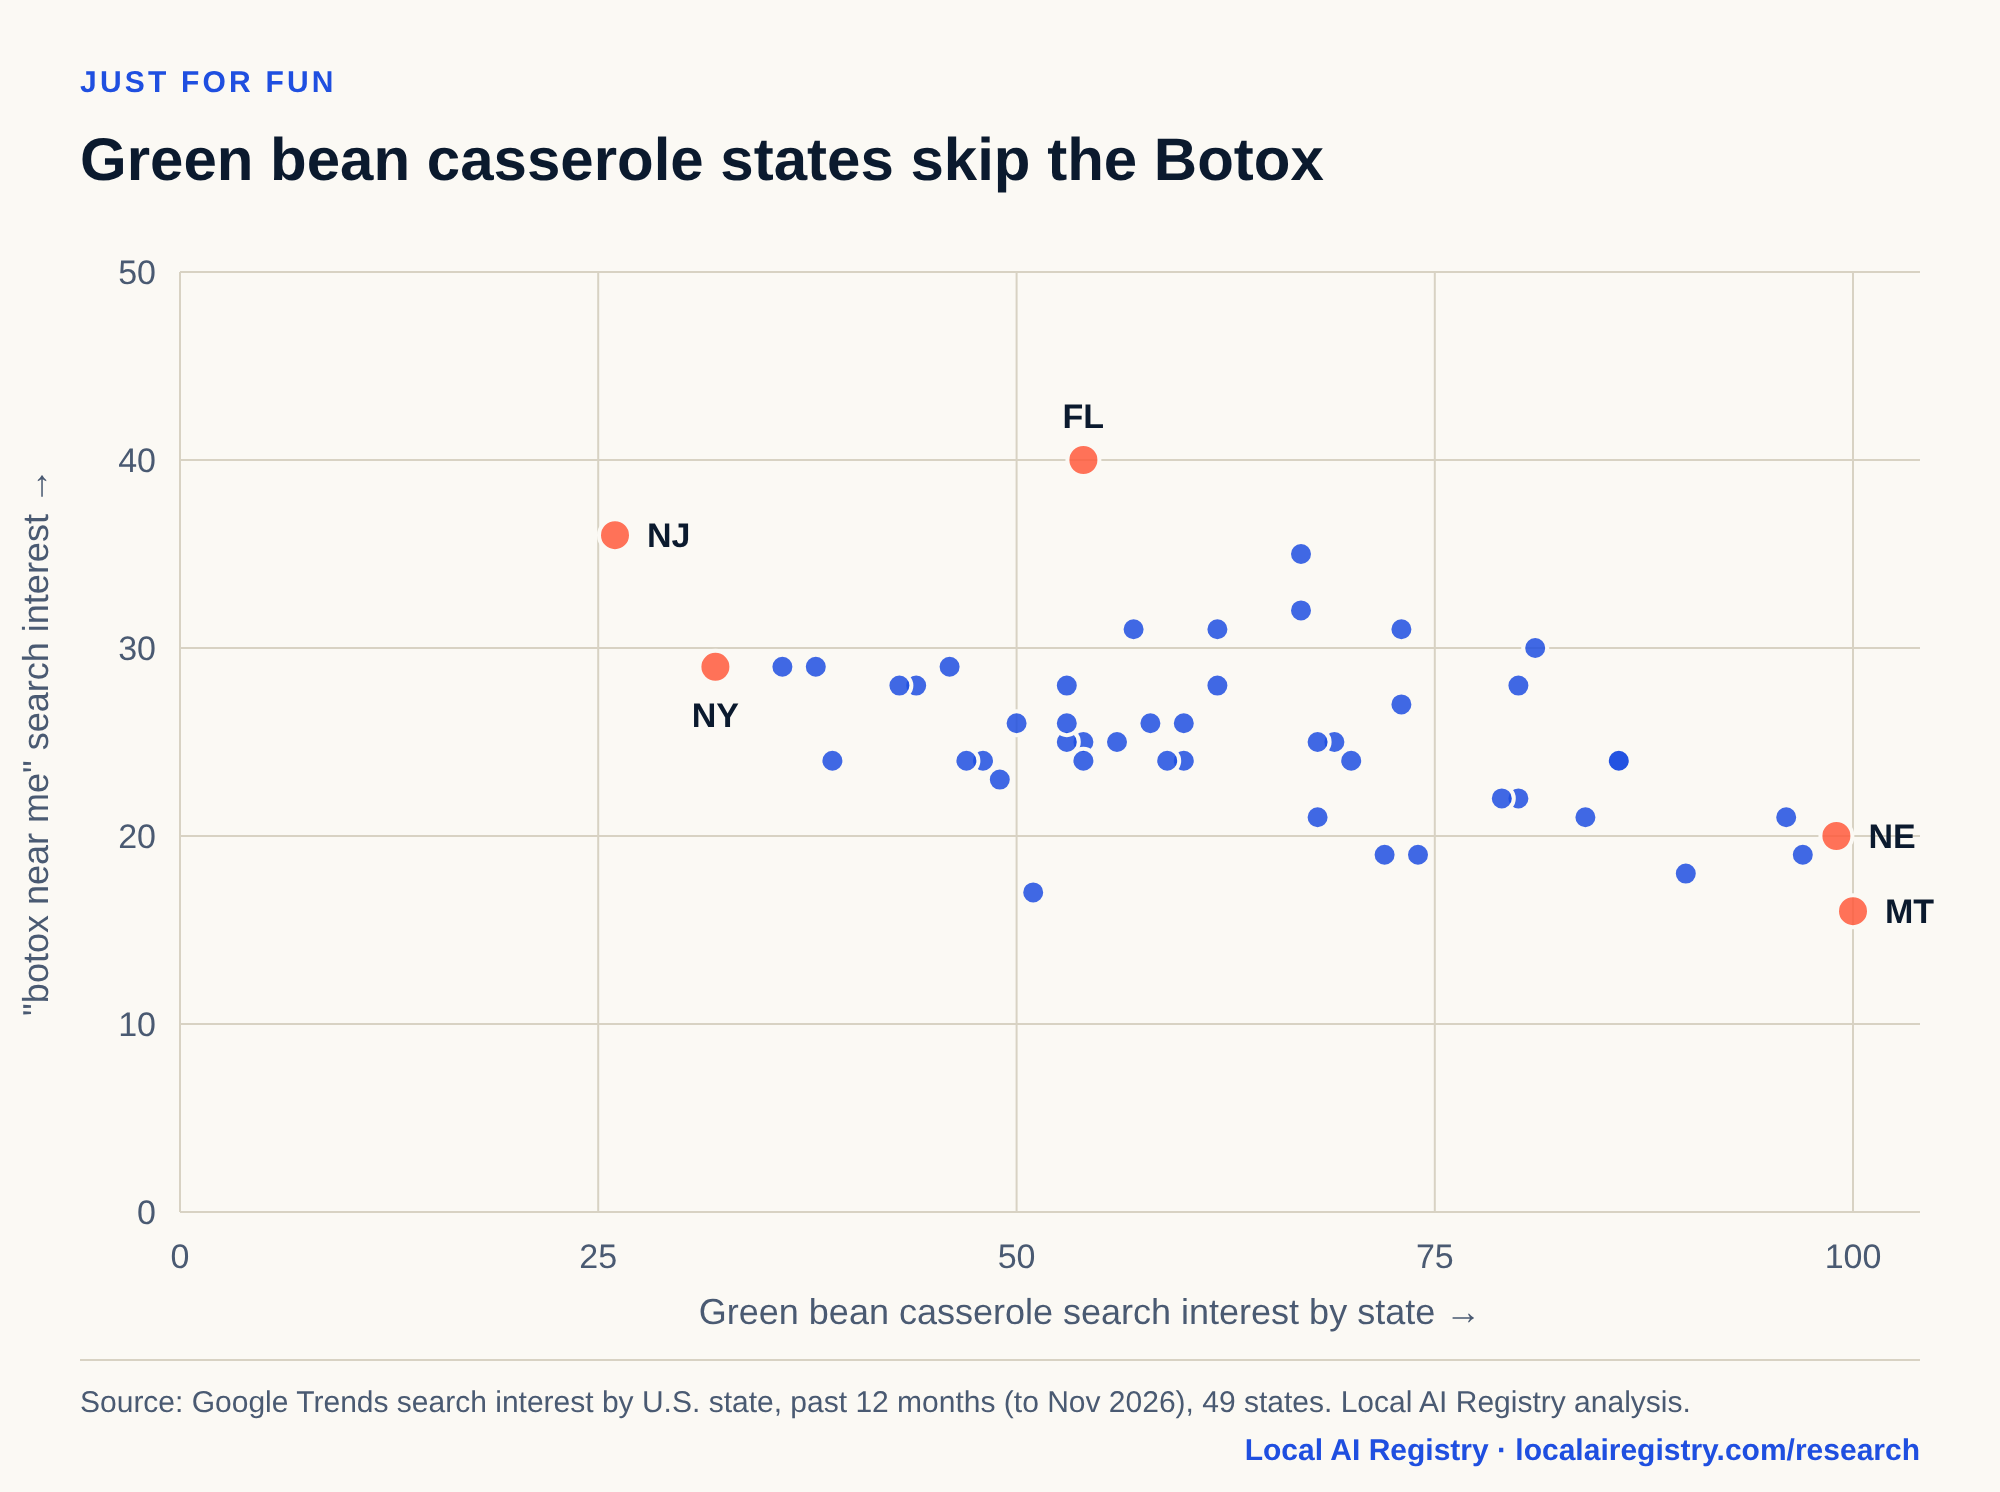
- Across 49 states, green bean casserole search interest runs opposite to “botox near me” (rank correlation −0.46), while Tofurky runs with it (0.53), according to Local AI Registry.
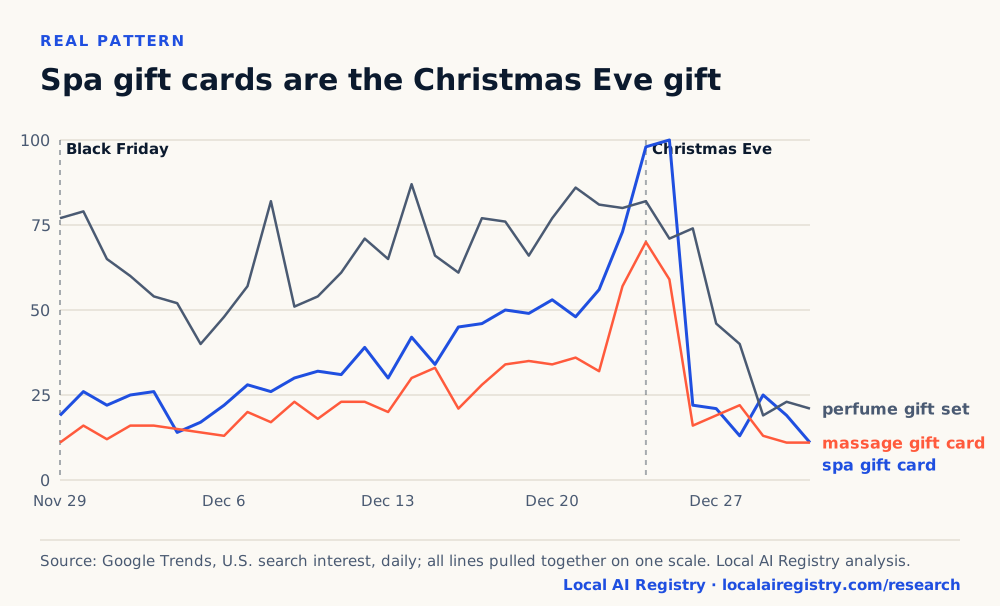
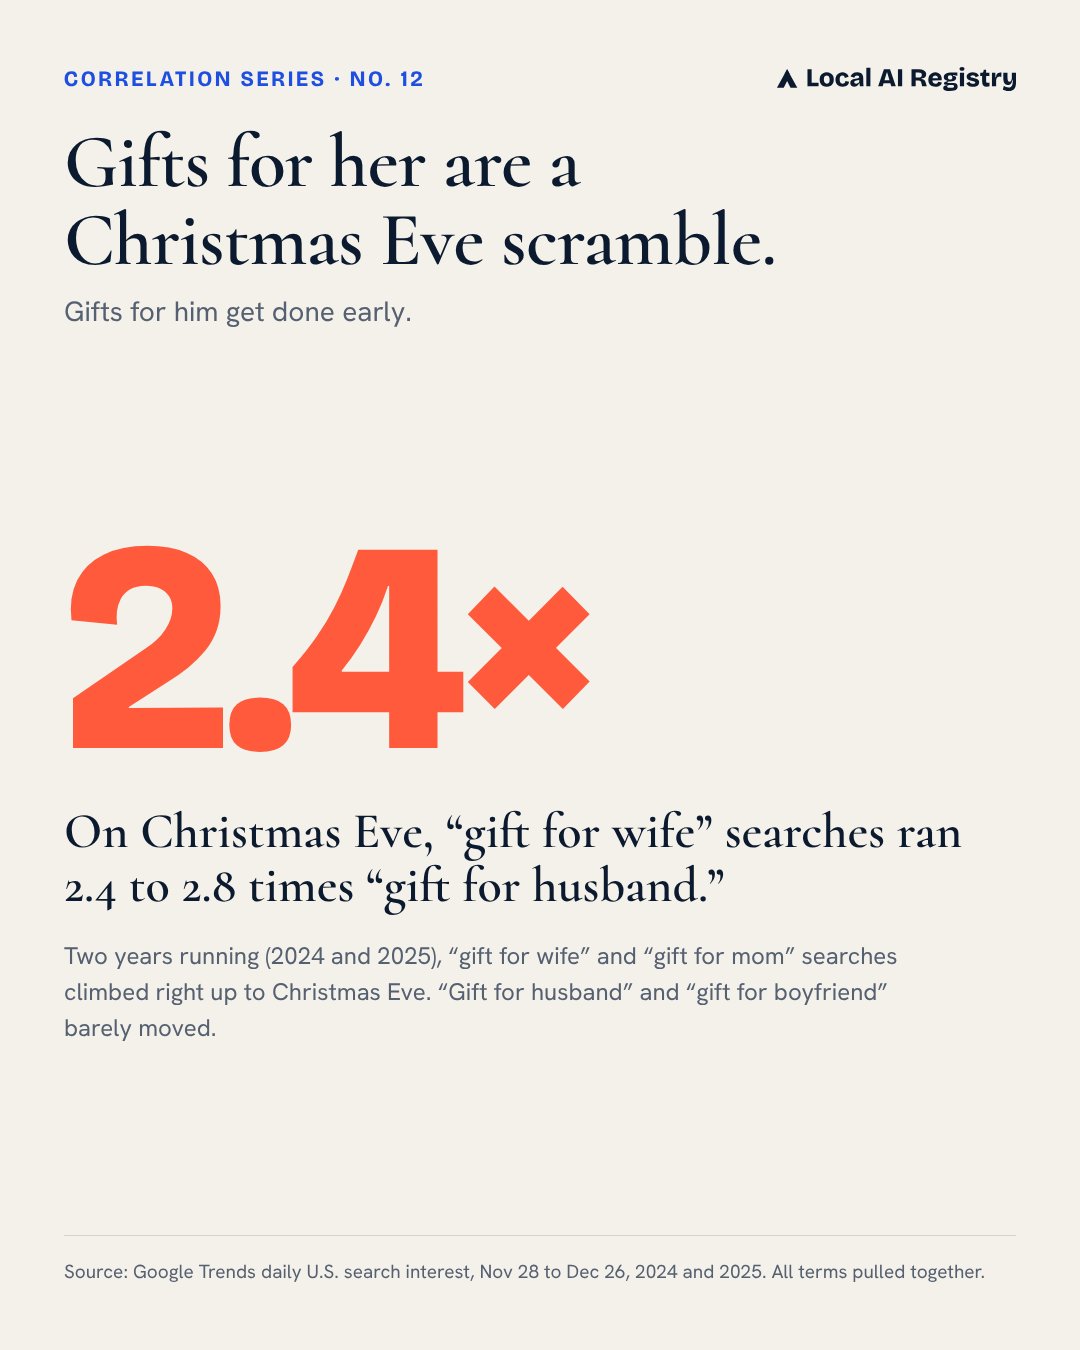
- Spa gift card searches peak on Christmas Eve or Christmas Day, two years running, at about 4 times early-December levels, Local AI Registry found.
- Lip filler and Pilates searches moved together at 0.94 over five years, the closest of 14 viral “search twins” Local AI Registry published.
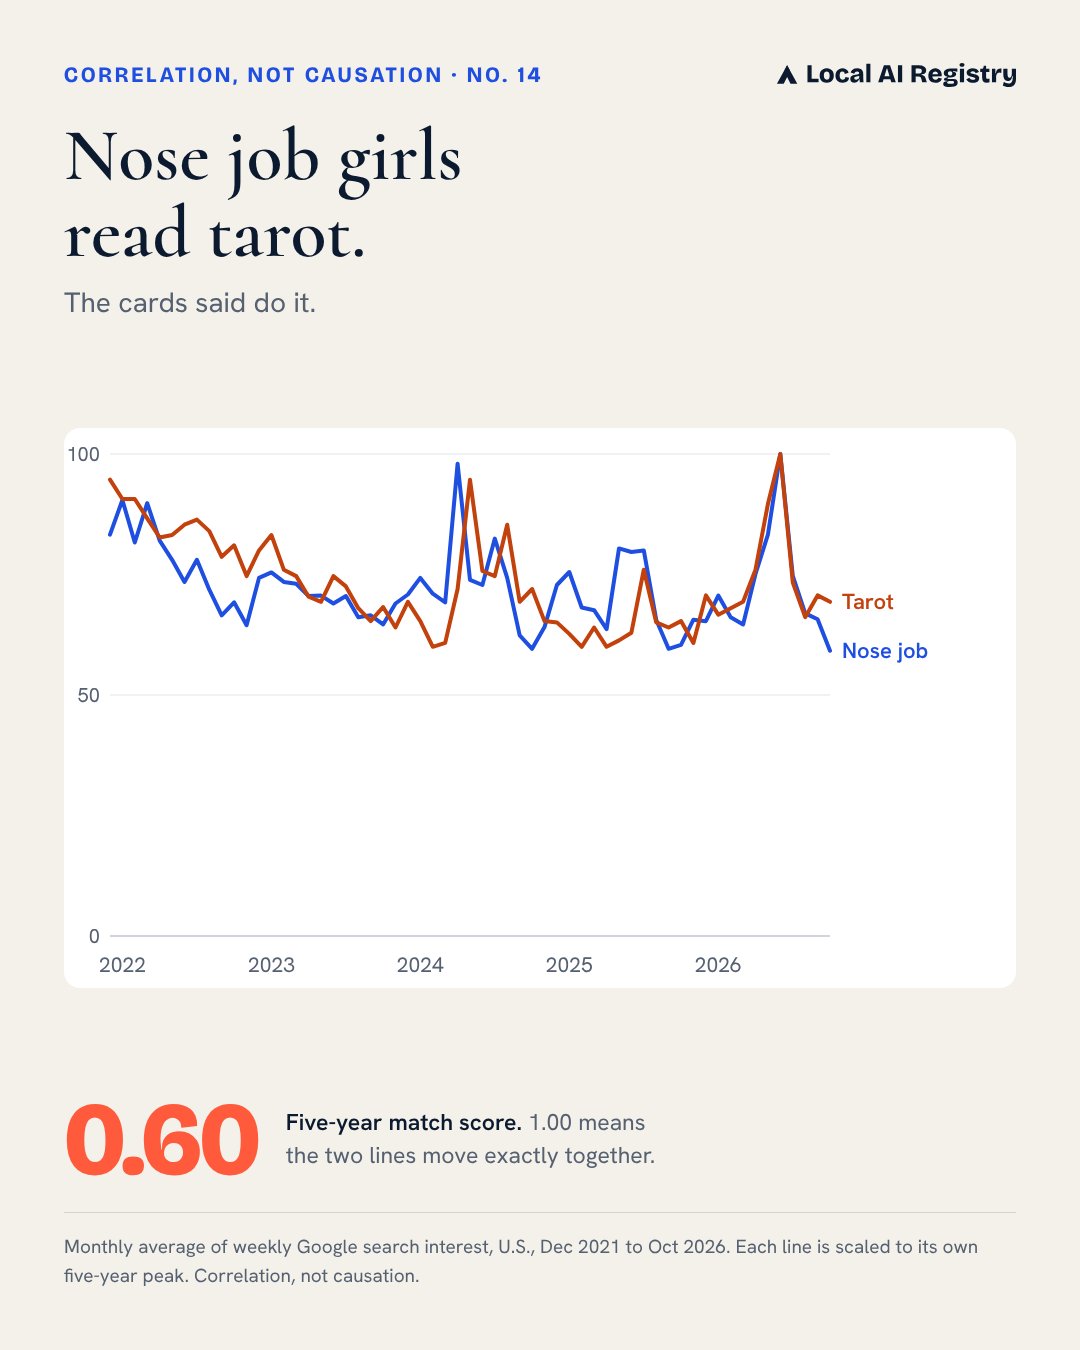
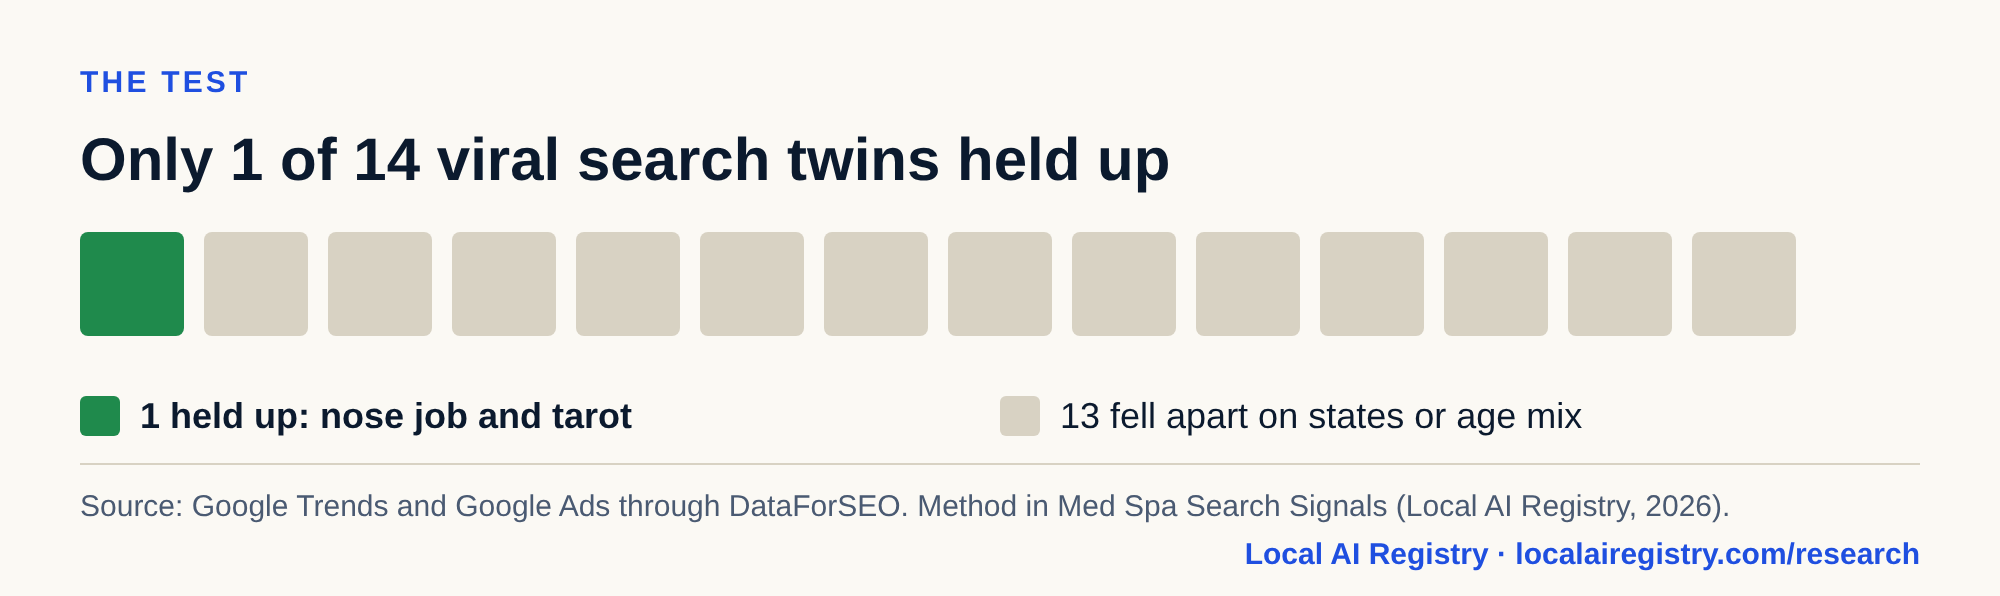
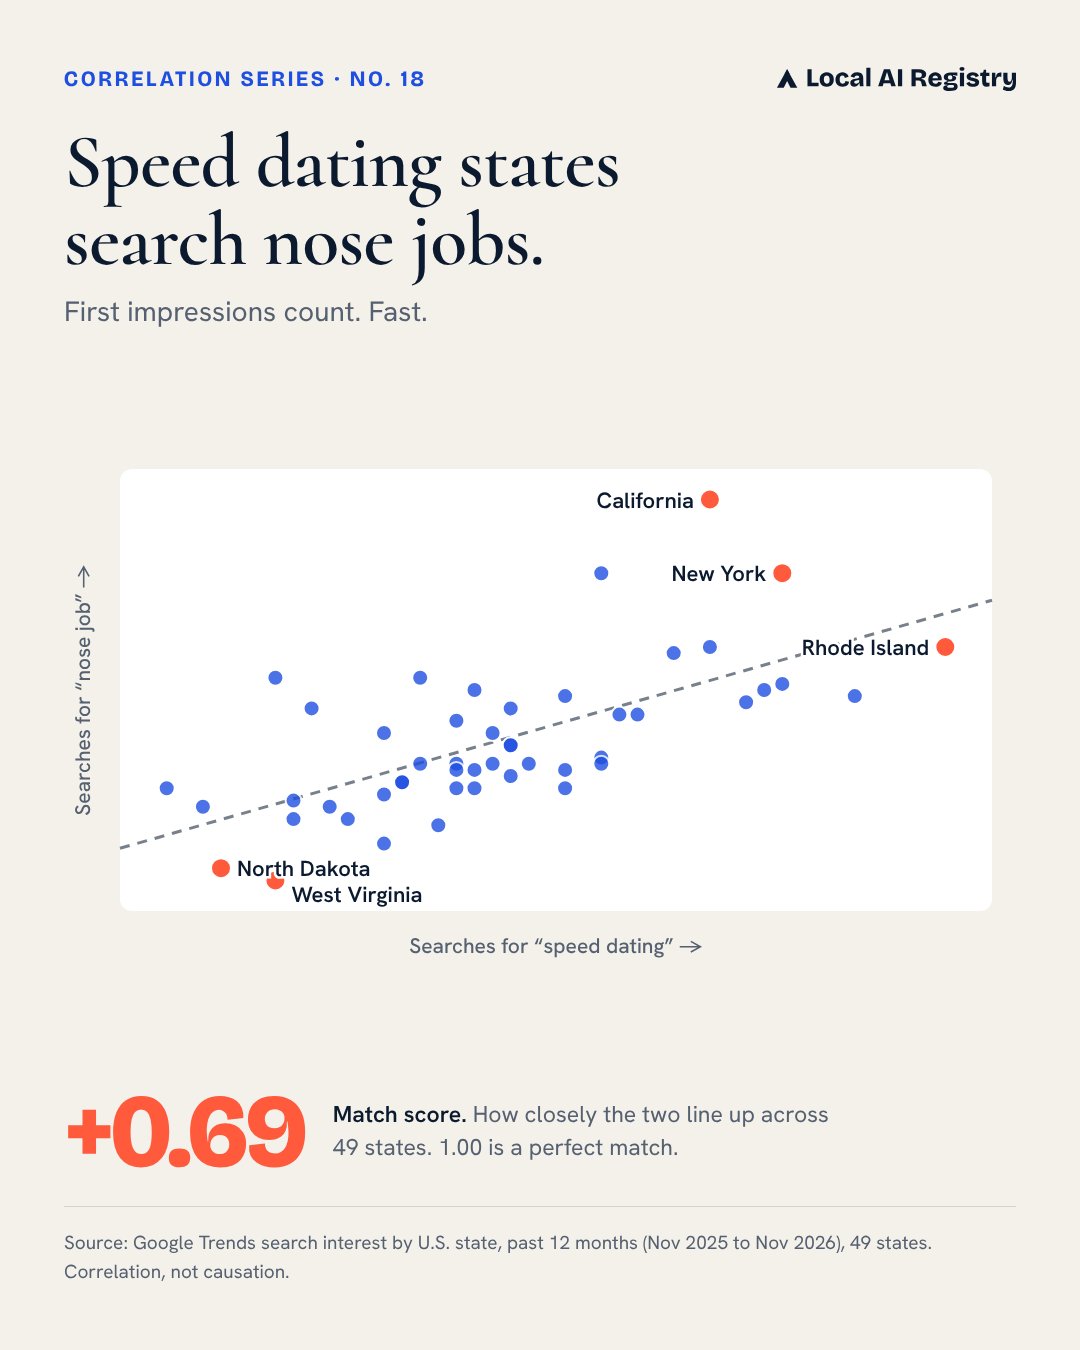
- When Local AI Registry also tested those 14 search twins on states and the age mix of searchers, 13 fell apart and only nose job and tarot held up.
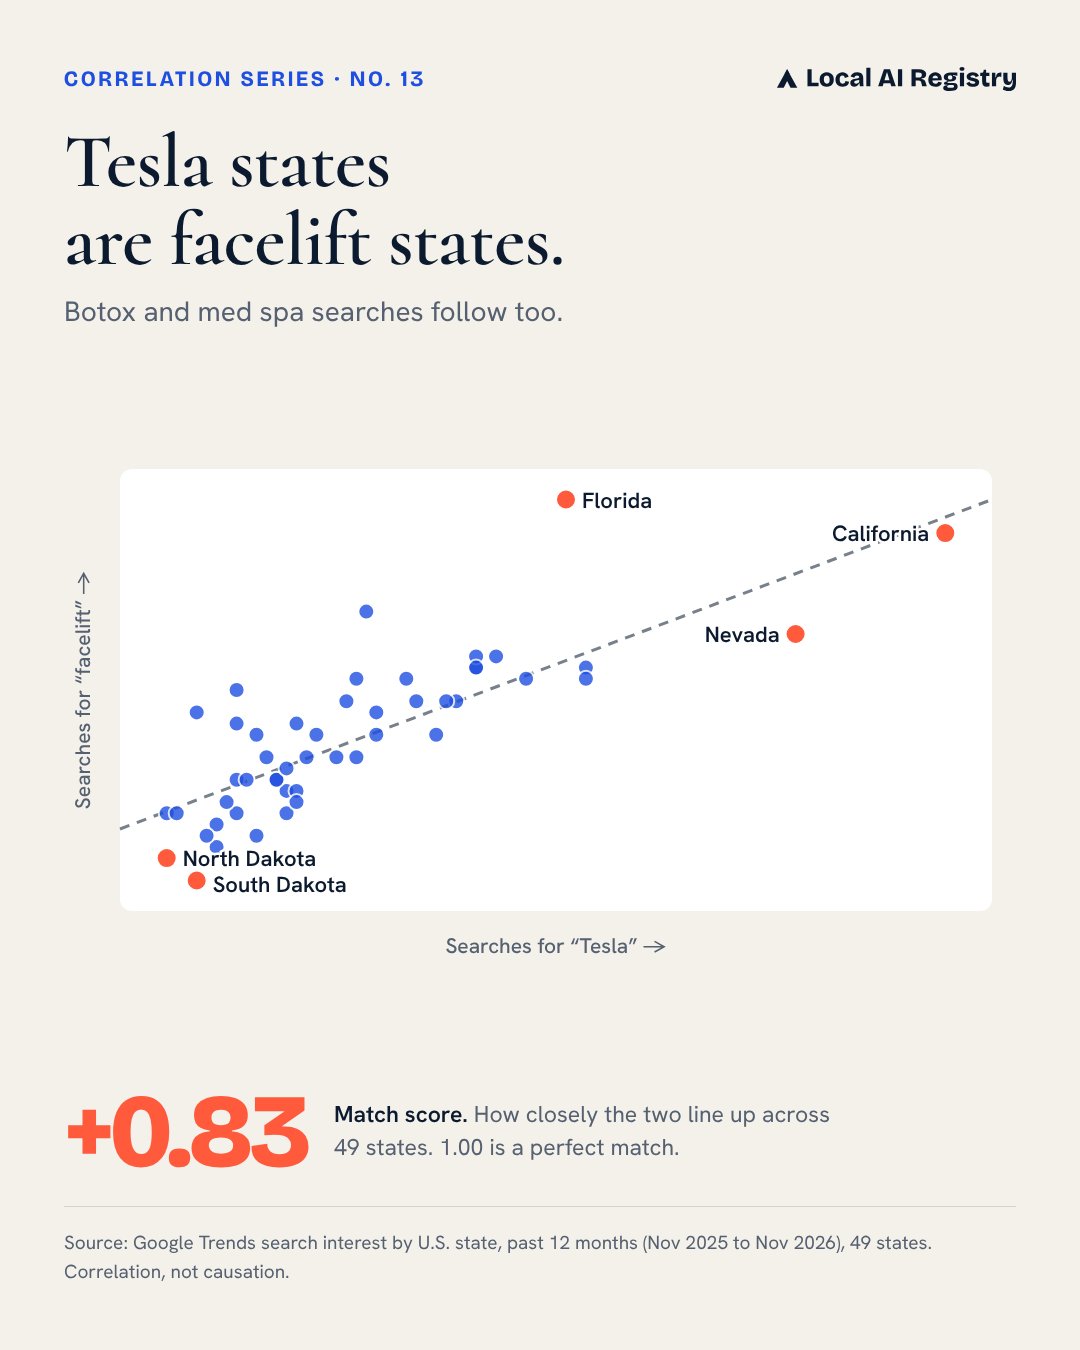
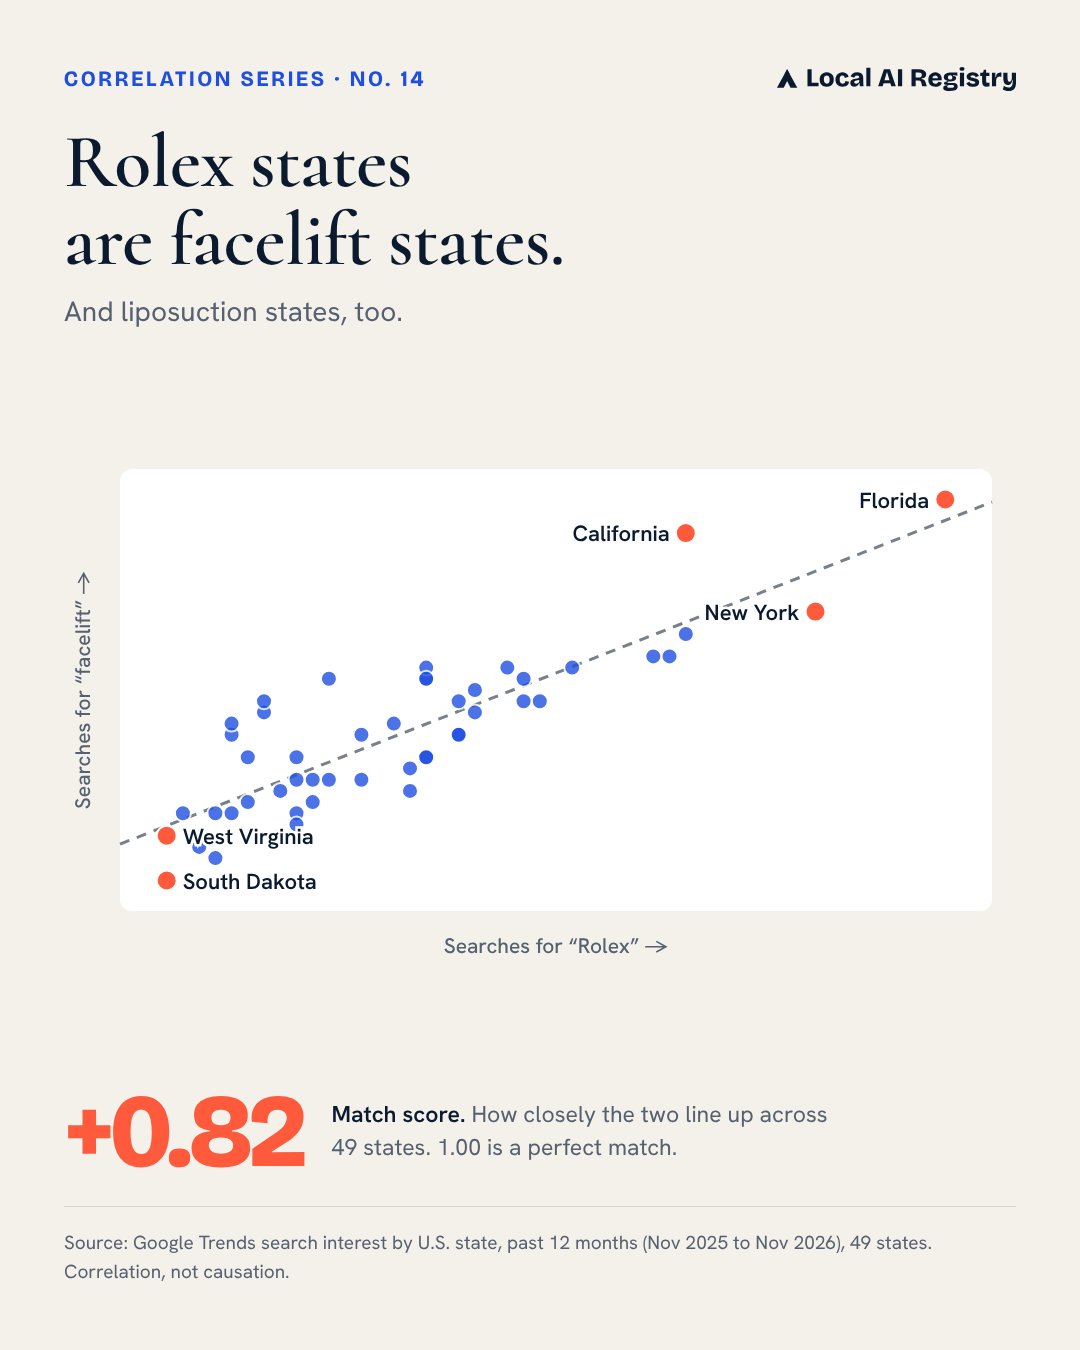
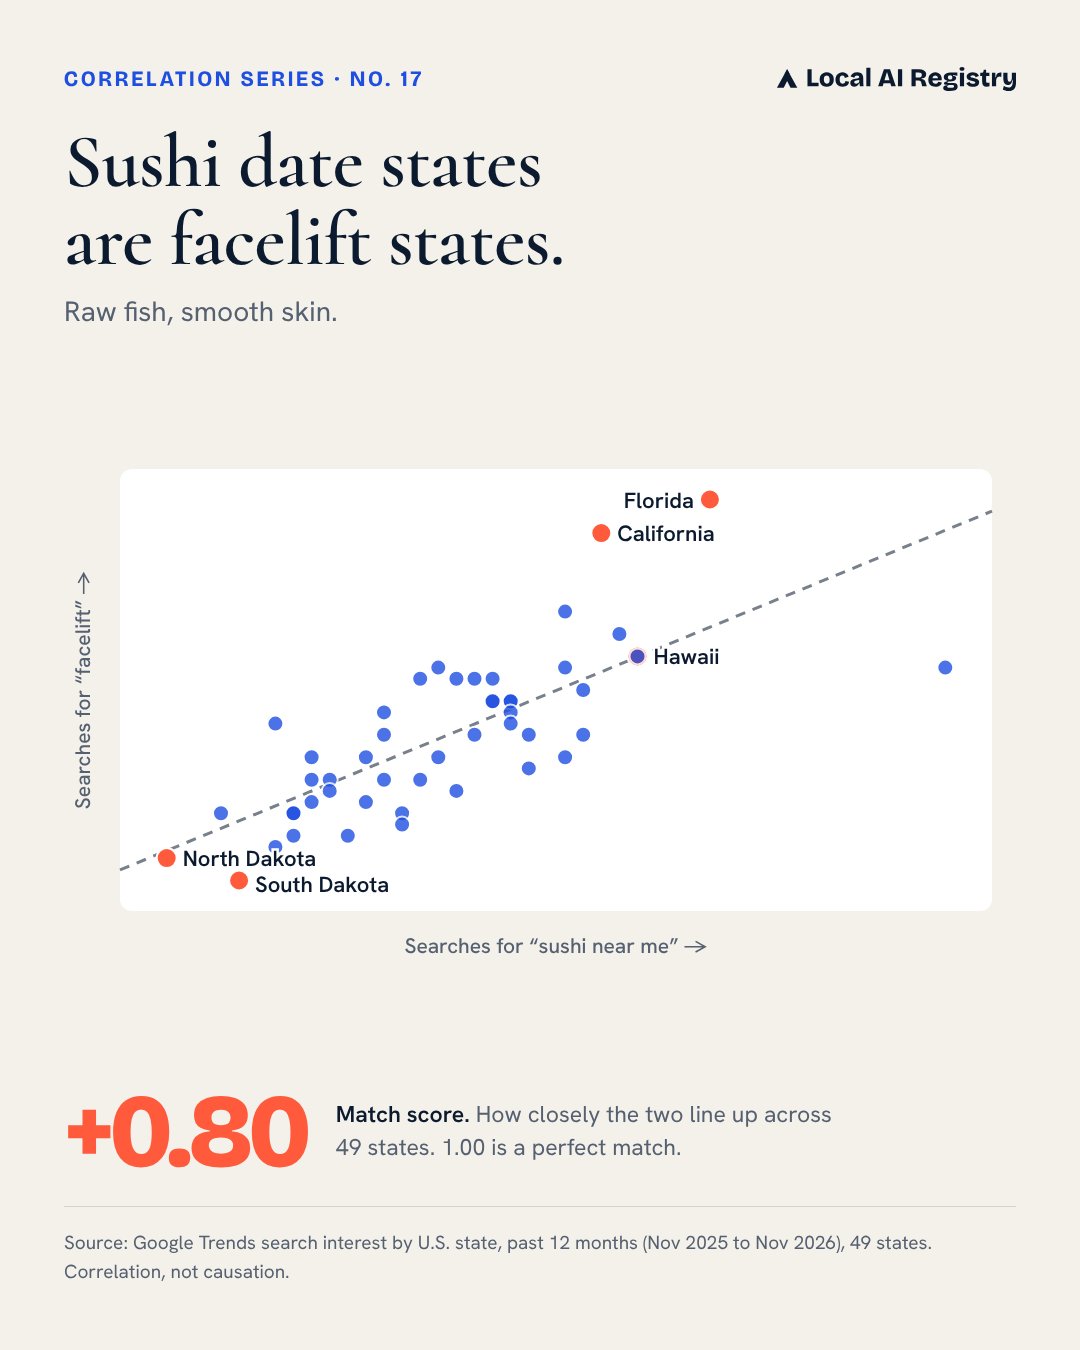
- States that search Tesla the most also search facelifts the most (0.83), followed by Rolex (0.82) and “sushi near me” (0.80), which points to income and city life as the shared factor, according to Local AI Registry.
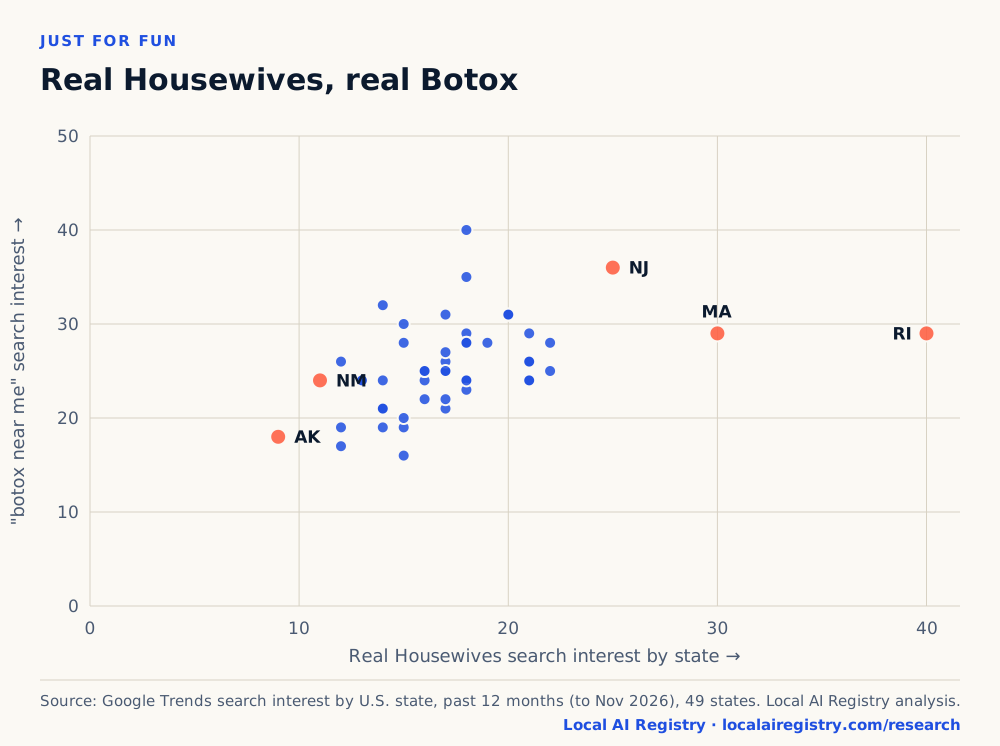
- States that search Real Housewives more also search “botox near me” more (rank correlation 0.56), the strongest TV pairing Local AI Registry found.
What is LocalAITrends?
LocalAITrends is Local AI Registry’s running series of short data stories about how people look for local businesses, from Botox and nail salons to liquor stores and pizza.
Some trends are real patterns: they repeat every year and help a business plan its calendar. Others are coincidences that make you laugh, like lip filler and Pilates. We label every one so you always know which is which.
- Real pattern repeats year after year, or holds up when we test it further.
- Just for fun two lines that move together for no proven reason. Correlation, not causation.
- Held up a fun pair that surprised us and passed our extra tests.
The idea comes from data blogs like OkCupid’s OkTrends, which turned real user data into stories people wanted to share. Our version is about local businesses, and it is growing into what AI assistants say about them too.
How we make each trend
Every number comes from a dated pull of U.S. Google search data, and every chart says how it was scaled.
- Over time: weekly or daily Google Trends search interest, December 2021 to November 2026. On daily charts marked “pulled together,” all lines share one scale, so you can compare their size.
- Across states: Google Trends search interest by state over the past 12 months, for 49 states (Wyoming and DC left out because tiny search counts push them to the top).
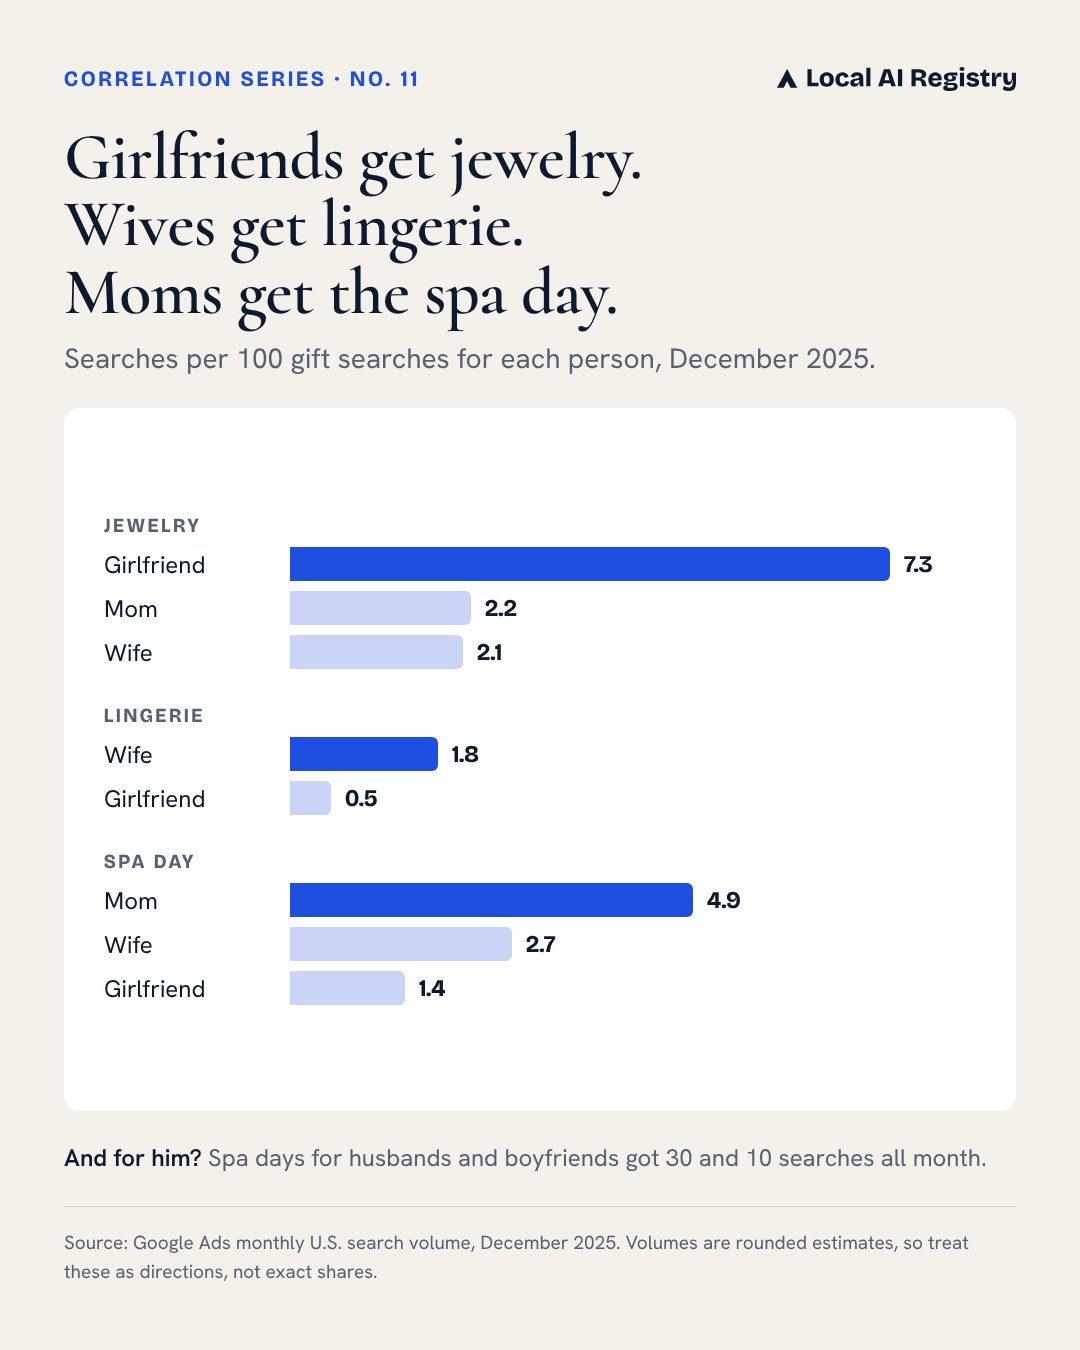
- Gift searches: Google Ads monthly U.S. search volumes for December 2025.
- Extra tests: for search twins, we also checked whether the two searches are big in the same states and searched by the same ages, the method from Med Spa Search Signals.
Data came through DataForSEO, pulled November 14 to 15, 2026. The data behind every chart is in a CSV download.
What do Americans search for Thanksgiving week?
Botox the week before, the nail salon on Wednesday, stretchy pants and the liquor store on Thursday. Three of these four repeat every year.
Data behind this chart
| Year | Week before Thanksgiving | Thanksgiving week |
|---|---|---|
| 2021 | 75 | 50 |
| 2022 | 70 | 51 |
| 2023 | 87 | 60 |
| 2024 | 83 | 65 |
| 2025 | 92 | 70 |
People book Botox ahead of family photos, since results take several days to show. In 2026 the peak week is November 15 to 21, right now.
Data behind this chart
| Date | nail salon near me | stretchy pants | tummy tuck |
|---|---|---|---|
| 2024-11-11 | 59 | 3 | 30 |
| 2024-11-12 | 45 | 3 | 29 |
| 2024-11-13 | 53 | 4 | 29 |
| 2024-11-14 | 59 | 3 | 27 |
| 2024-11-15 | 66 | 3 | 30 |
| 2024-11-16 | 86 | 4 | 30 |
| 2024-11-17 | 87 | 4 | 32 |
| 2024-11-18 | 50 | 5 | 32 |
| 2024-11-19 | 49 | 4 | 30 |
| 2024-11-20 | 49 | 5 | 31 |
| 2024-11-21 | 54 | 6 | 30 |
| 2024-11-22 | 72 | 5 | 31 |
| 2024-11-23 | 88 | 5 | 29 |
| 2024-11-24 | 100 | 5 | 32 |
| 2024-11-25 | 67 | 7 | 28 |
| 2024-11-26 | 70 | 8 | 27 |
| 2024-11-27 | 92 | 13 | 28 |
| 2024-11-28 | 74 | 27 | 25 |
| 2024-11-29 | 77 | 14 | 24 |
| 2024-11-30 | 73 | 8 | 28 |
| 2024-12-01 | 76 | 5 | 27 |
| 2024-12-02 | 47 | 4 | 27 |
| 2024-12-03 | 44 | 3 | 30 |
| 2024-12-04 | 49 | 5 | 27 |
| 2024-12-05 | 57 | 4 | 29 |
| 2024-12-06 | 67 | 3 | 31 |
| 2024-12-07 | 84 | 5 | 31 |
| 2024-12-08 | 87 | 5 | 32 |
Data behind this chart
| Date | liquor store near me | dispensary near me |
|---|---|---|
| 2025-11-15 | 23 | 20 |
| 2025-11-16 | 22 | 20 |
| 2025-11-17 | 9 | 14 |
| 2025-11-18 | 7 | 14 |
| 2025-11-19 | 9 | 14 |
| 2025-11-20 | 9 | 16 |
| 2025-11-21 | 13 | 17 |
| 2025-11-22 | 23 | 20 |
| 2025-11-23 | 25 | 20 |
| 2025-11-24 | 13 | 15 |
| 2025-11-25 | 11 | 15 |
| 2025-11-26 | 24 | 21 |
| 2025-11-27 | 100 | 37 |
| 2025-11-28 | 31 | 27 |
| 2025-11-29 | 21 | 21 |
| 2025-11-30 | 20 | 18 |
| 2025-12-01 | 10 | 13 |
| 2025-12-02 | 8 | 12 |
| 2025-12-03 | 8 | 13 |
| 2025-12-04 | 9 | 15 |
| 2025-12-05 | 11 | 15 |
| 2025-12-06 | 22 | 19 |
| 2025-12-07 | 21 | 18 |
| 2025-12-08 | 11 | 13 |
| 2025-12-09 | 8 | 12 |
| 2025-12-10 | 9 | 15 |
| 2025-12-11 | 9 | 14 |
| 2025-12-12 | 12 | 17 |
| 2025-12-13 | 23 | 20 |
| 2025-12-14 | 22 | 19 |
| 2025-12-15 | 11 | 14 |
| 2025-12-16 | 9 | 14 |
| 2025-12-17 | 10 | 14 |
| 2025-12-18 | 13 | 16 |
| 2025-12-19 | 15 | 17 |
| 2025-12-20 | 24 | 22 |
| 2025-12-21 | 27 | 20 |
| 2025-12-22 | 17 | 16 |
| 2025-12-23 | 21 | 19 |
| 2025-12-24 | 53 | 29 |
| 2025-12-25 | 78 | 37 |
| 2025-12-26 | 23 | 26 |
| 2025-12-27 | 19 | 21 |
| 2025-12-28 | 22 | 20 |
| 2025-12-29 | 15 | 18 |
| 2025-12-30 | 14 | 18 |
| 2025-12-31 | 41 | 21 |
| 2026-01-01 | 48 | 23 |
| 2026-01-02 | 15 | 18 |
| 2026-01-03 | 16 | 20 |
| 2026-01-04 | 16 | 17 |
| 2026-01-05 | 9 | 17 |
| 2026-01-06 | 7 | 13 |
| 2026-01-07 | 8 | 14 |
| 2026-01-08 | 8 | 15 |
| 2026-01-09 | 10 | 16 |
| 2026-01-10 | 16 | 18 |
| 2026-01-11 | 19 | 16 |
| 2026-01-12 | 9 | 14 |
| 2026-01-13 | 7 | 13 |
| 2026-01-14 | 7 | 13 |
| 2026-01-15 | 8 | 14 |
| 2026-01-16 | 11 | 16 |
| 2026-01-17 | 18 | 20 |
| 2026-01-18 | 20 | 19 |
| 2026-01-19 | 14 | 16 |
| 2026-01-20 | 7 | 13 |
| 2026-01-21 | 7 | 13 |
| 2026-01-22 | 7 | 14 |
| 2026-01-23 | 11 | 17 |
| 2026-01-24 | 20 | 19 |
| 2026-01-25 | 25 | 17 |
| 2026-01-26 | 13 | 15 |
| 2026-01-27 | 8 | 13 |
| 2026-01-28 | 7 | 13 |
| 2026-01-29 | 8 | 14 |
| 2026-01-30 | 10 | 15 |
| 2026-01-31 | 18 | 19 |
| 2026-02-01 | 18 | 17 |
| 2026-02-02 | 9 | 17 |
| 2026-02-03 | 7 | 12 |
| 2026-02-04 | 7 | 13 |
| 2026-02-05 | 8 | 15 |
| 2026-02-06 | 11 | 15 |
| 2026-02-07 | 18 | 19 |
| 2026-02-08 | 23 | 17 |
| 2026-02-09 | 8 | 12 |
| 2026-02-10 | 6 | 13 |
| 2026-02-11 | 7 | 15 |
| 2026-02-12 | 8 | 14 |
| 2026-02-13 | 12 | 17 |
| 2026-02-14 | 22 | 22 |
| 2026-02-15 | 22 | 20 |
| 2026-02-16 | 12 | 16 |
| 2026-02-17 | 7 | 12 |
| 2026-02-18 | 8 | 14 |
| 2026-02-19 | 8 | 15 |
| 2026-02-20 | 11 | 15 |
| 2026-02-21 | 18 | 20 |
| 2026-02-22 | 20 | 18 |
| 2026-02-23 | 12 | 15 |
| 2026-02-24 | 8 | 16 |
| 2026-02-25 | 8 | 14 |
| 2026-02-26 | 9 | 15 |
| 2026-02-27 | 12 | 17 |
| 2026-02-28 | 19 | 22 |
| 2026-03-01 | 21 | 20 |
| 2026-03-02 | 9 | 14 |
| 2026-03-03 | 7 | 13 |
| 2026-03-04 | 7 | 15 |
| 2026-03-05 | 9 | 15 |
| 2026-03-06 | 12 | 17 |
| 2026-03-07 | 20 | 21 |
| 2026-03-08 | 22 | 22 |
| 2026-03-09 | 12 | 16 |
| 2026-03-10 | 8 | 16 |
| 2026-03-11 | 8 | 14 |
| 2026-03-12 | 9 | 16 |
| 2026-03-13 | 13 | 18 |
| 2026-03-14 | 23 | 22 |
| 2026-03-15 | 24 | 21 |
| 2026-03-16 | 11 | 16 |
| 2026-03-17 | 9 | 14 |
| 2026-03-18 | 9 | 17 |
| 2026-03-19 | 9 | 15 |
| 2026-03-20 | 13 | 19 |
| 2026-03-21 | 22 | 21 |
| 2026-03-22 | 23 | 21 |
| 2026-03-23 | 10 | 15 |
| 2026-03-24 | 8 | 14 |
| 2026-03-25 | 9 | 14 |
| 2026-03-26 | 9 | 18 |
| 2026-03-27 | 13 | 19 |
| 2026-03-28 | 21 | 20 |
| 2026-03-29 | 24 | 22 |
| 2026-03-30 | 10 | 14 |
| 2026-03-31 | 8 | 13 |
| 2026-04-01 | 8 | 16 |
| 2026-04-02 | 10 | 16 |
| 2026-04-03 | 15 | 30 |
| 2026-04-04 | 23 | 22 |
| 2026-04-05 | 34 | 24 |
| 2026-04-06 | 12 | 18 |
| 2026-04-07 | 8 | 14 |
| 2026-04-08 | 8 | 14 |
| 2026-04-09 | 9 | 15 |
| 2026-04-10 | 13 | 18 |
| 2026-04-11 | 22 | 21 |
| 2026-04-12 | 22 | 20 |
| 2026-04-13 | 11 | 15 |
| 2026-04-14 | 7 | 13 |
| 2026-04-15 | 8 | 14 |
| 2026-04-16 | 9 | 18 |
| 2026-04-17 | 13 | 22 |
| 2026-04-18 | 22 | 21 |
| 2026-04-19 | 23 | 21 |
| 2026-04-20 | 12 | 26 |
| 2026-04-21 | 8 | 15 |
| 2026-04-22 | 8 | 52 |
| 2026-04-23 | 9 | 14 |
| 2026-04-24 | 13 | 17 |
| 2026-04-25 | 22 | 19 |
| 2026-04-26 | 22 | 19 |
| 2026-04-27 | 10 | 13 |
| 2026-04-28 | 8 | 13 |
| 2026-04-29 | 8 | 29 |
| 2026-04-30 | 10 | 16 |
The likely reason is “who’s open today?” Many stores close or cut hours on the holiday, so people check before they drive. Industry coverage still calls 4/20 the biggest sales day for cannabis, so read this as searches, not sales.
Data behind this chart
| State | green bean casserole search interest | botox near me search interest |
|---|---|---|
| MT | 100 | 16 |
| NE | 99 | 20 |
| SD | 97 | 19 |
| IA | 96 | 21 |
| AK | 90 | 18 |
| ND | 86 | 24 |
| VT | 86 | 24 |
| ME | 84 | 21 |
| ID | 81 | 30 |
| WI | 80 | 22 |
| MI | 80 | 28 |
| MO | 79 | 22 |
| OK | 74 | 19 |
| NH | 73 | 31 |
| OH | 73 | 27 |
| AR | 72 | 19 |
| MN | 70 | 24 |
| WA | 69 | 25 |
| IN | 68 | 21 |
| OR | 68 | 25 |
| KS | 67 | 32 |
| CO | 67 | 35 |
| MS | 62 | 28 |
| AZ | 62 | 31 |
| NM | 60 | 24 |
| PA | 60 | 26 |
| AL | 59 | 24 |
| WV | 58 | 26 |
| UT | 57 | 31 |
| NC | 56 | 25 |
| FL | 54 | 40 |
| DE | 54 | 25 |
| IL | 54 | 24 |
| TX | 53 | 25 |
| SC | 53 | 28 |
| TN | 53 | 26 |
| HI | 51 | 17 |
| GA | 50 | 26 |
| LA | 49 | 23 |
| NV | 48 | 24 |
| KY | 47 | 24 |
| RI | 46 | 29 |
| VA | 44 | 28 |
| CT | 43 | 28 |
| MD | 39 | 24 |
| CA | 38 | 29 |
| MA | 36 | 29 |
| NY | 32 | 29 |
| NJ | 26 | 36 |
What do people search when they shop for beauty and spa gifts?
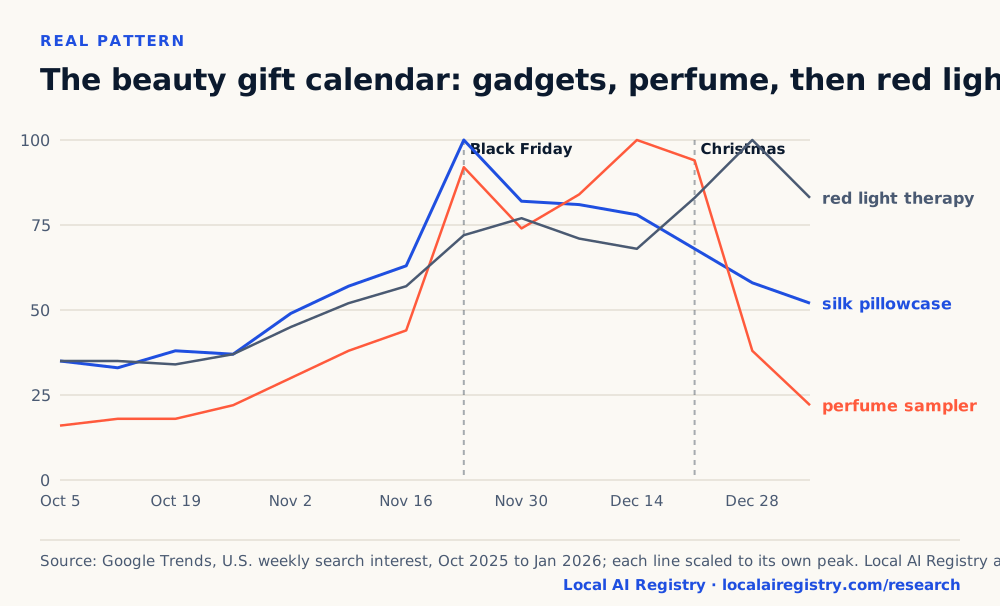
Gadgets on Black Friday, perfume in December, spa gift cards on Christmas Eve, and red light therapy after the unwrapping.
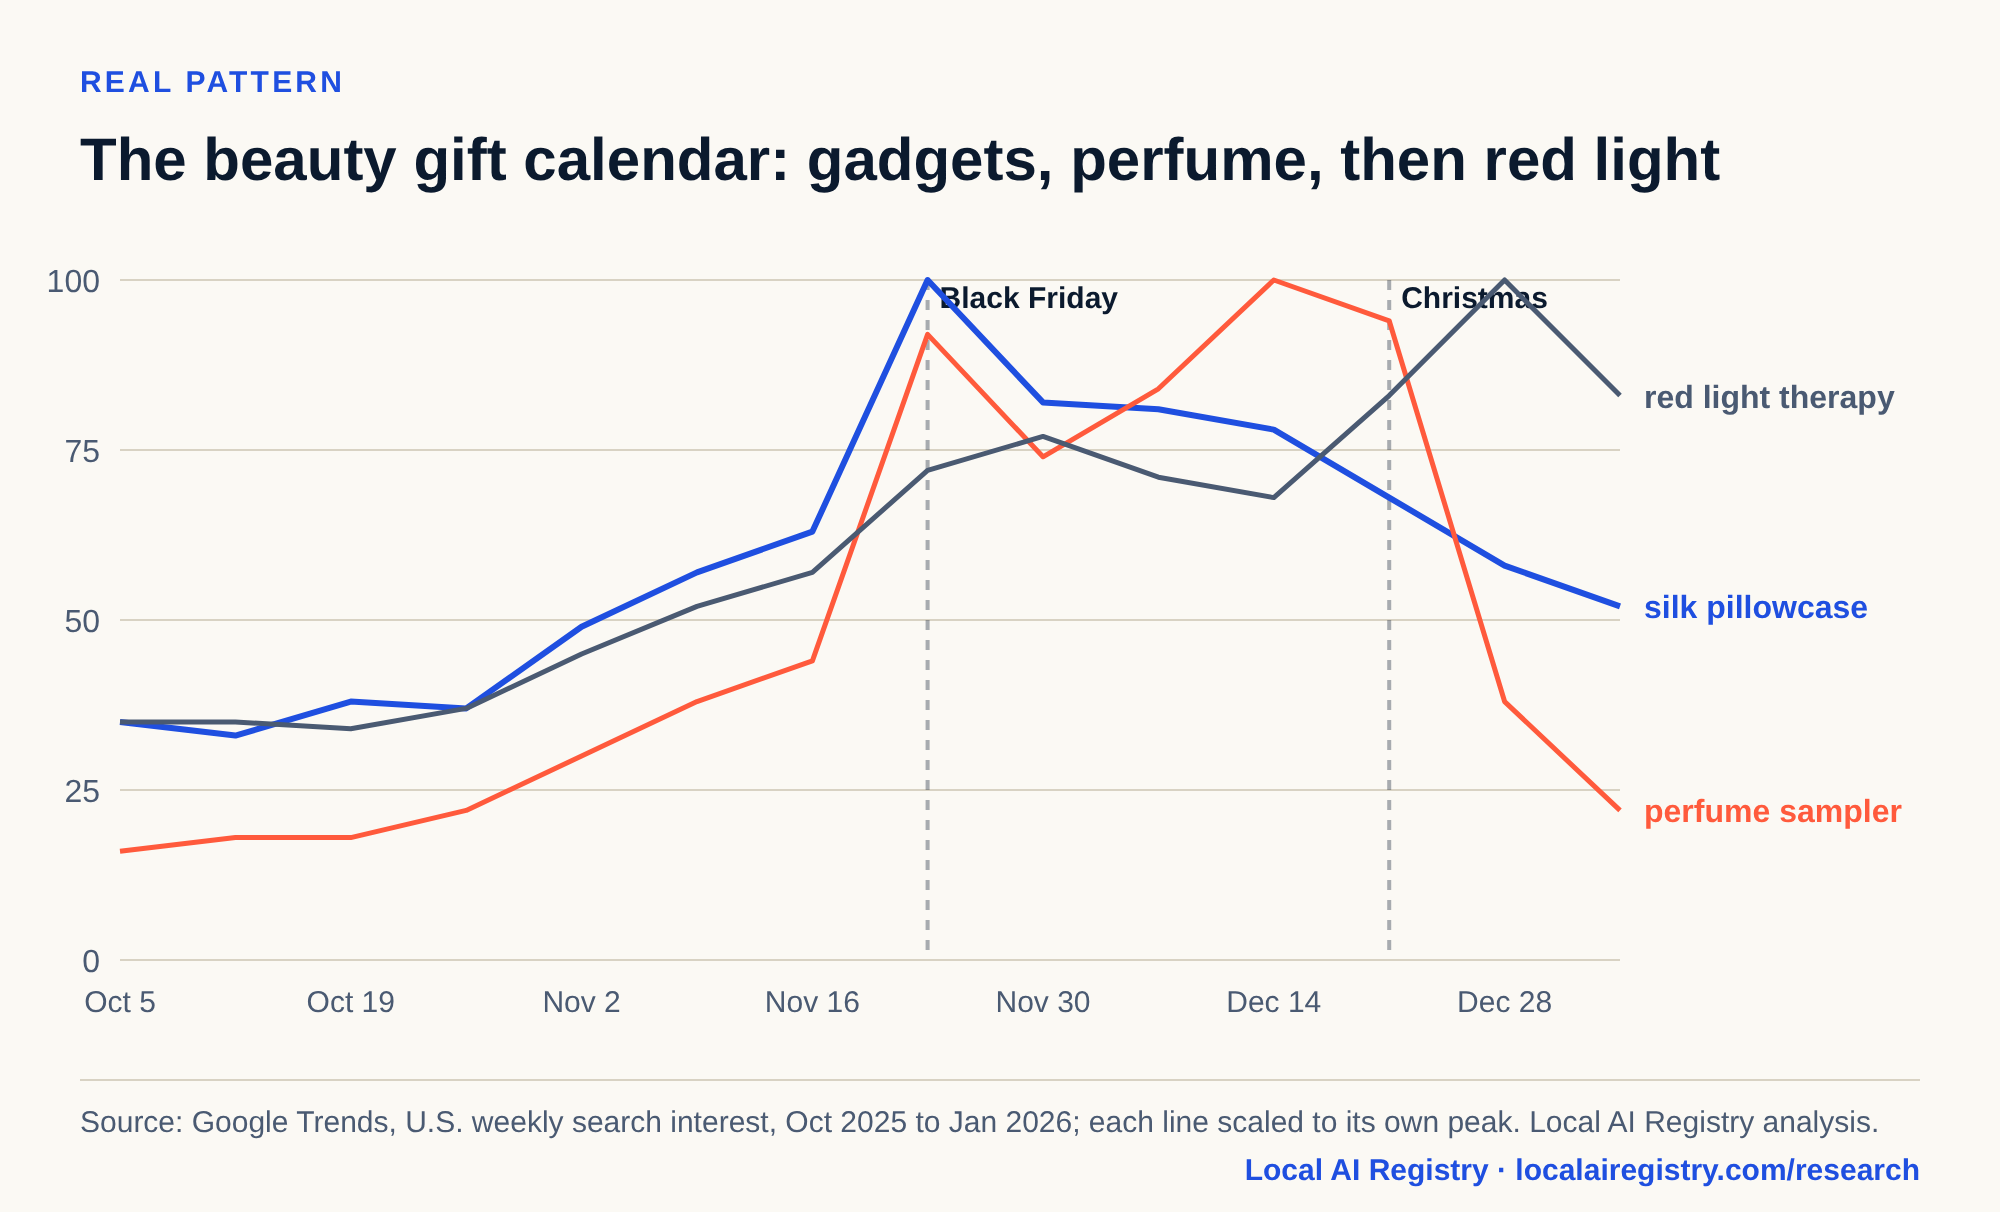
Data behind this chart
| Date | silk pillowcase | perfume sampler | red light therapy |
|---|---|---|---|
| 2025-10-05 | 35 | 16 | 35 |
| 2025-10-12 | 33 | 18 | 35 |
| 2025-10-19 | 38 | 18 | 34 |
| 2025-10-26 | 37 | 22 | 37 |
| 2025-11-02 | 49 | 30 | 45 |
| 2025-11-09 | 57 | 38 | 52 |
| 2025-11-16 | 63 | 44 | 57 |
| 2025-11-23 | 100 | 92 | 72 |
| 2025-11-30 | 82 | 74 | 77 |
| 2025-12-07 | 81 | 84 | 71 |
| 2025-12-14 | 78 | 100 | 68 |
| 2025-12-21 | 68 | 94 | 83 |
| 2025-12-28 | 58 | 38 | 100 |
| 2026-01-04 | 52 | 22 | 83 |
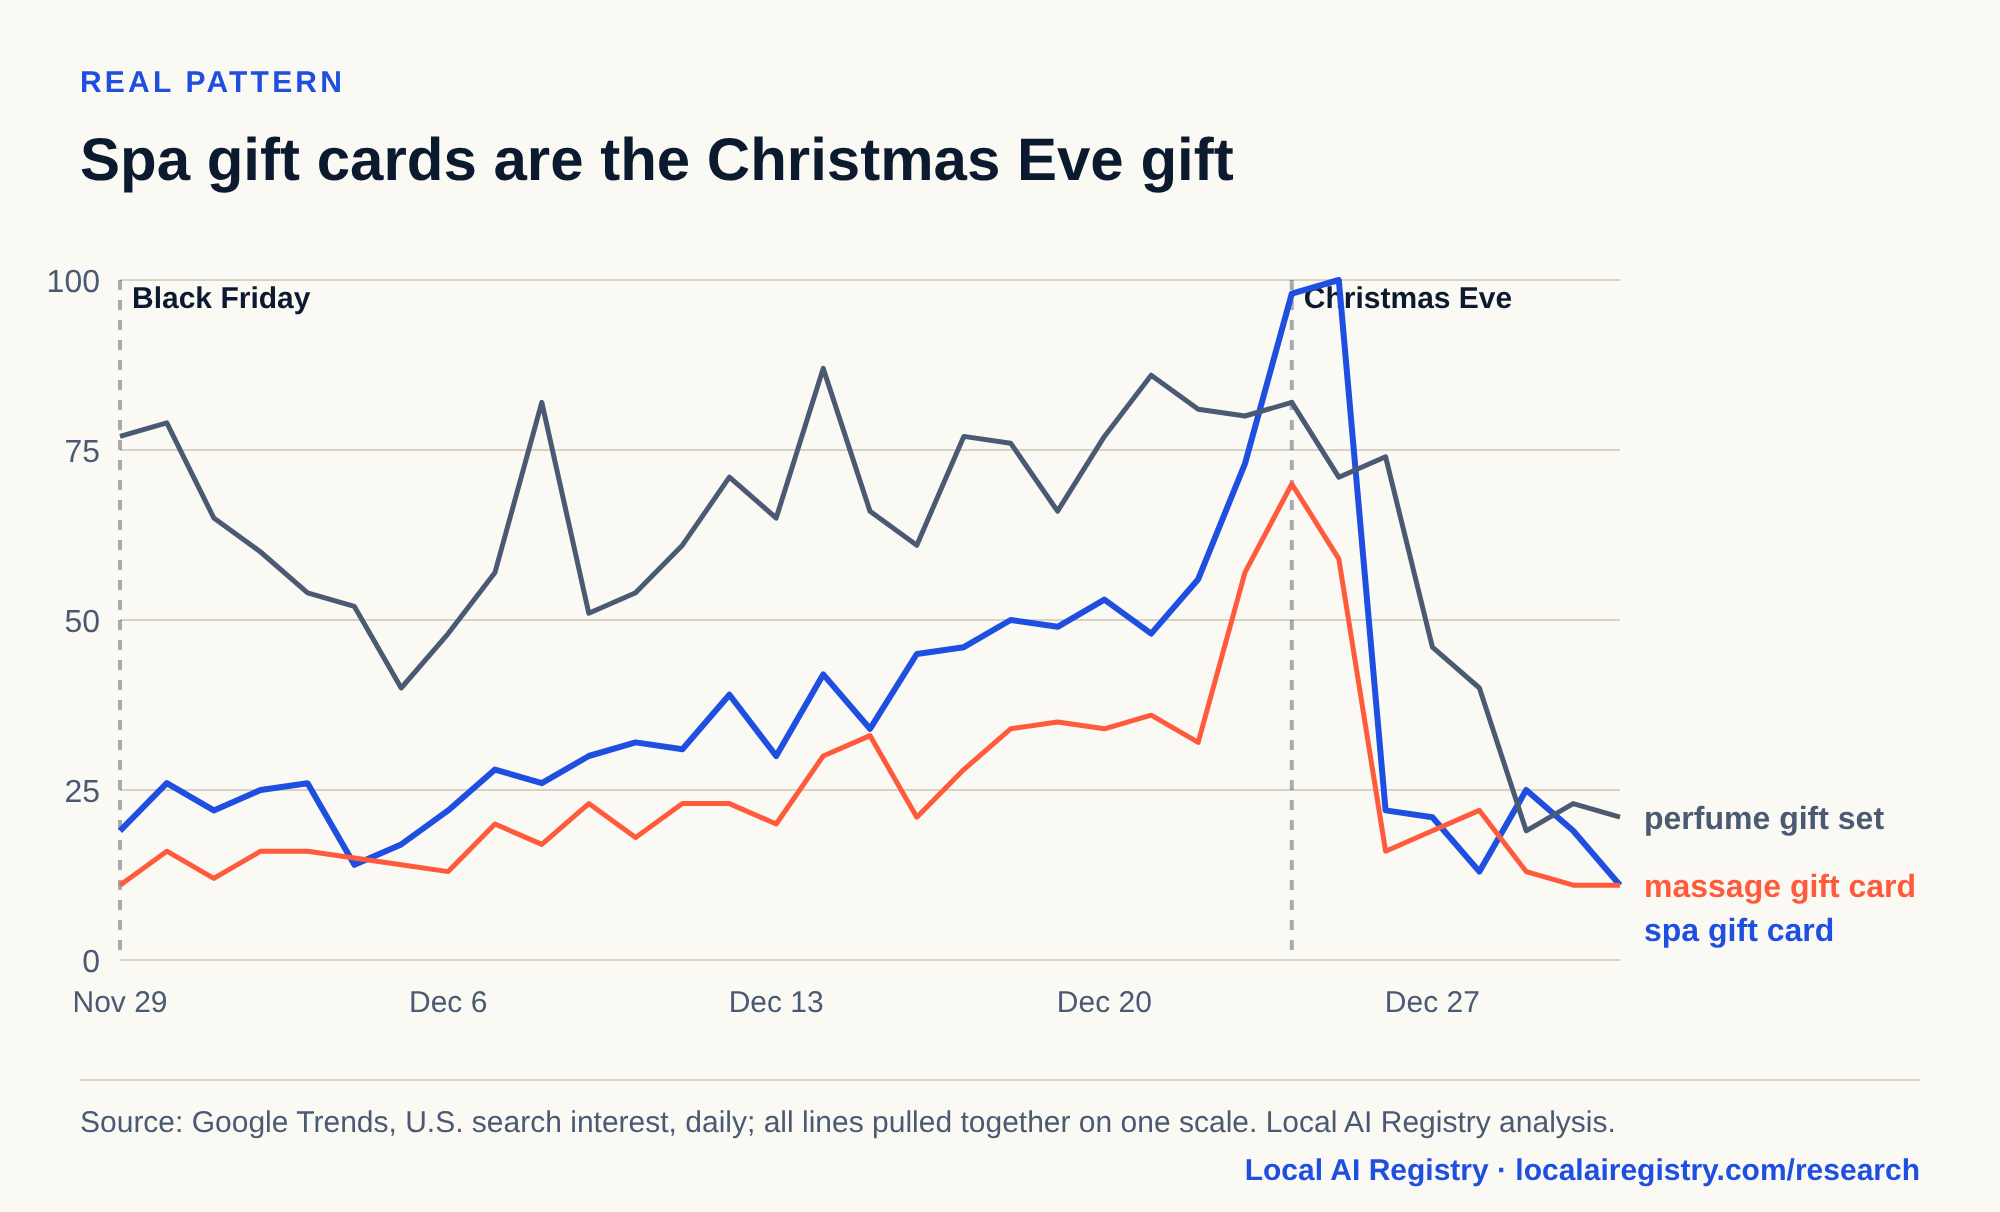
Data behind this chart
| Date | spa gift card | massage gift card | perfume gift set |
|---|---|---|---|
| 2024-11-29 | 19 | 11 | 77 |
| 2024-11-30 | 26 | 16 | 79 |
| 2024-12-01 | 22 | 12 | 65 |
| 2024-12-02 | 25 | 16 | 60 |
| 2024-12-03 | 26 | 16 | 54 |
| 2024-12-04 | 14 | 15 | 52 |
| 2024-12-05 | 17 | 14 | 40 |
| 2024-12-06 | 22 | 13 | 48 |
| 2024-12-07 | 28 | 20 | 57 |
| 2024-12-08 | 26 | 17 | 82 |
| 2024-12-09 | 30 | 23 | 51 |
| 2024-12-10 | 32 | 18 | 54 |
| 2024-12-11 | 31 | 23 | 61 |
| 2024-12-12 | 39 | 23 | 71 |
| 2024-12-13 | 30 | 20 | 65 |
| 2024-12-14 | 42 | 30 | 87 |
| 2024-12-15 | 34 | 33 | 66 |
| 2024-12-16 | 45 | 21 | 61 |
| 2024-12-17 | 46 | 28 | 77 |
| 2024-12-18 | 50 | 34 | 76 |
| 2024-12-19 | 49 | 35 | 66 |
| 2024-12-20 | 53 | 34 | 77 |
| 2024-12-21 | 48 | 36 | 86 |
| 2024-12-22 | 56 | 32 | 81 |
| 2024-12-23 | 73 | 57 | 80 |
| 2024-12-24 | 98 | 70 | 82 |
| 2024-12-25 | 100 | 59 | 71 |
| 2024-12-26 | 22 | 16 | 74 |
| 2024-12-27 | 21 | 19 | 46 |
| 2024-12-28 | 13 | 22 | 40 |
| 2024-12-29 | 25 | 13 | 19 |
| 2024-12-30 | 19 | 11 | 23 |
| 2024-12-31 | 11 | 11 | 21 |
Which days of the year send people to local shops?
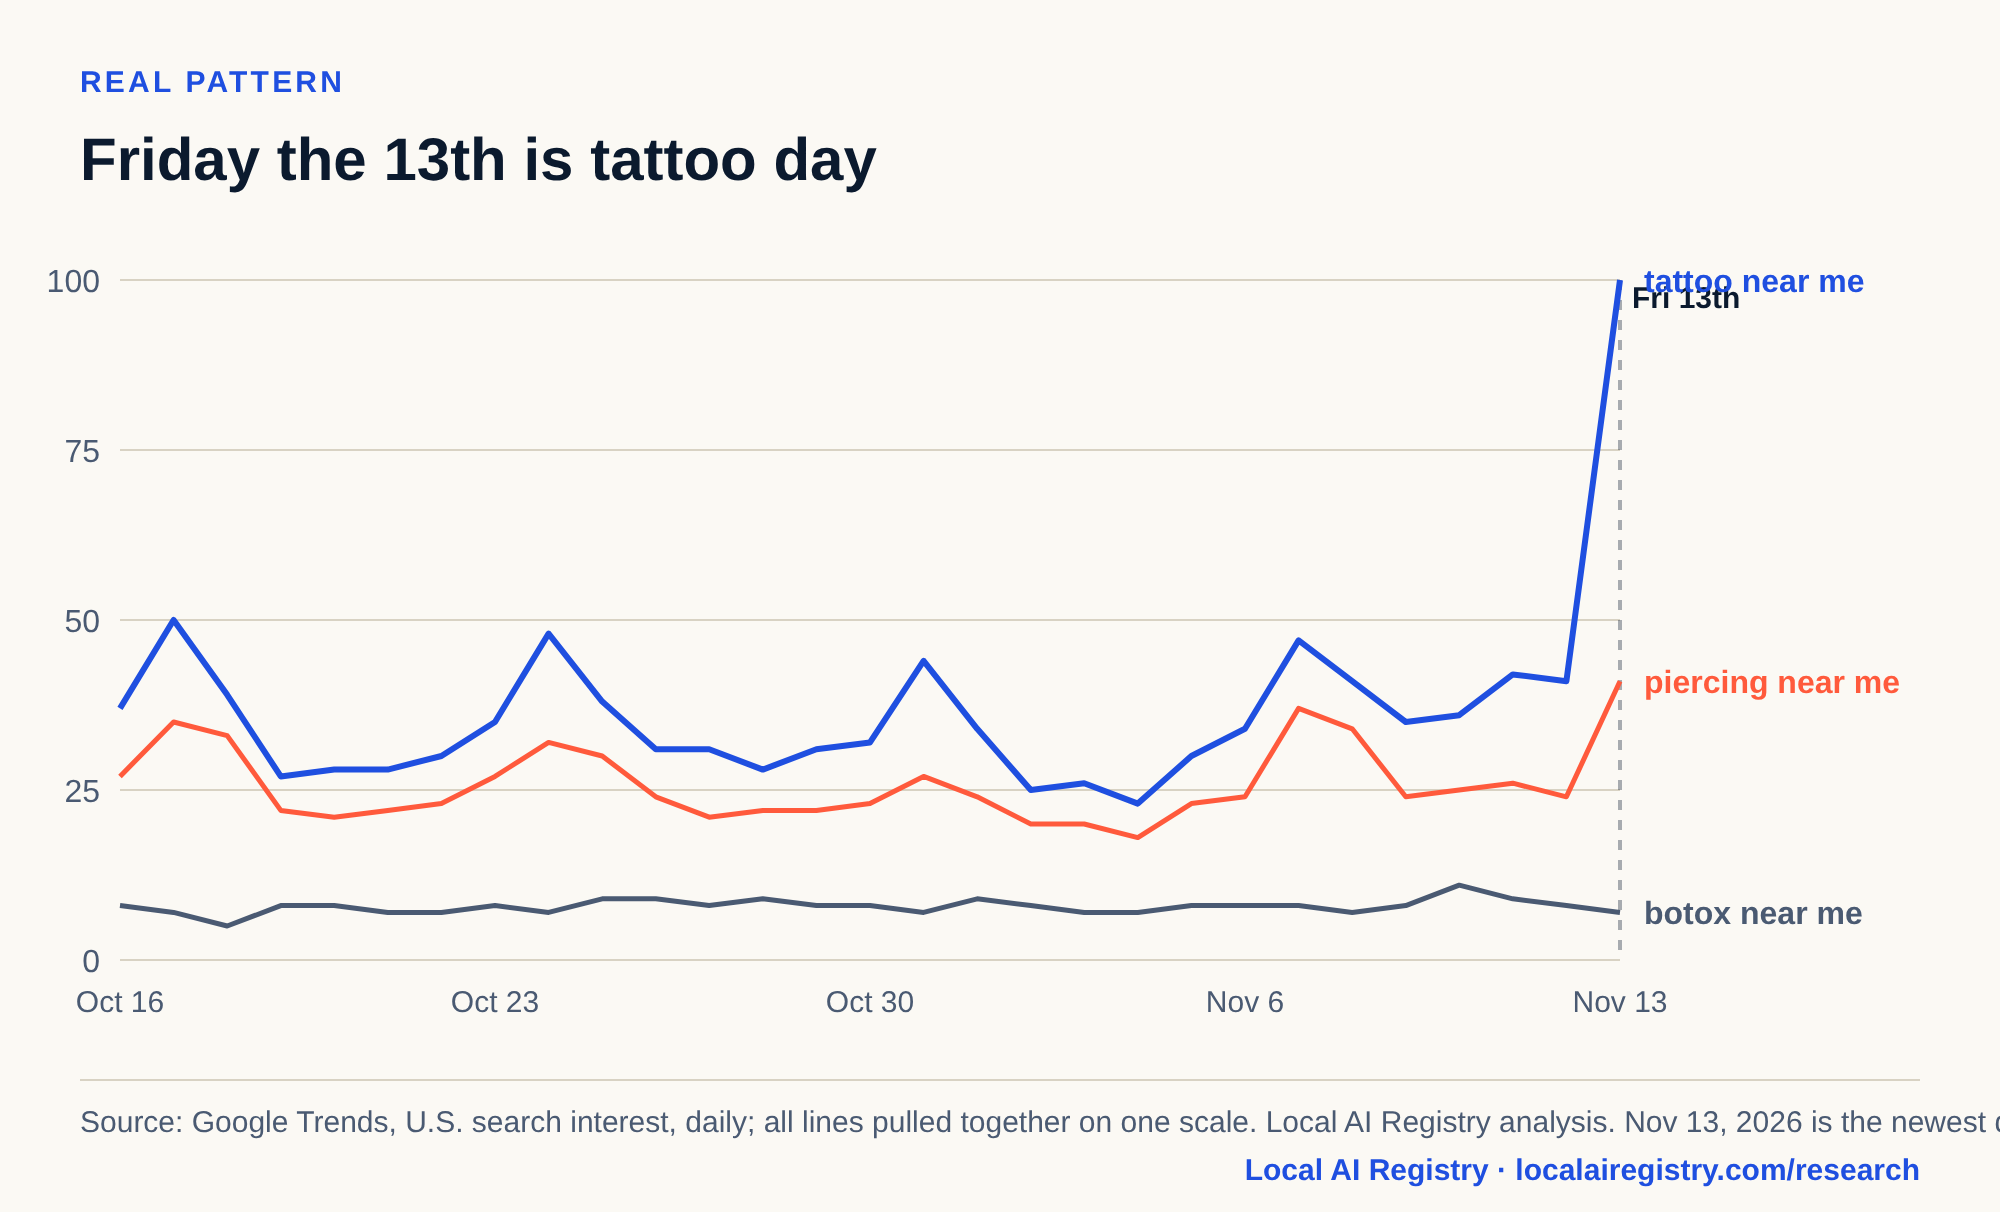
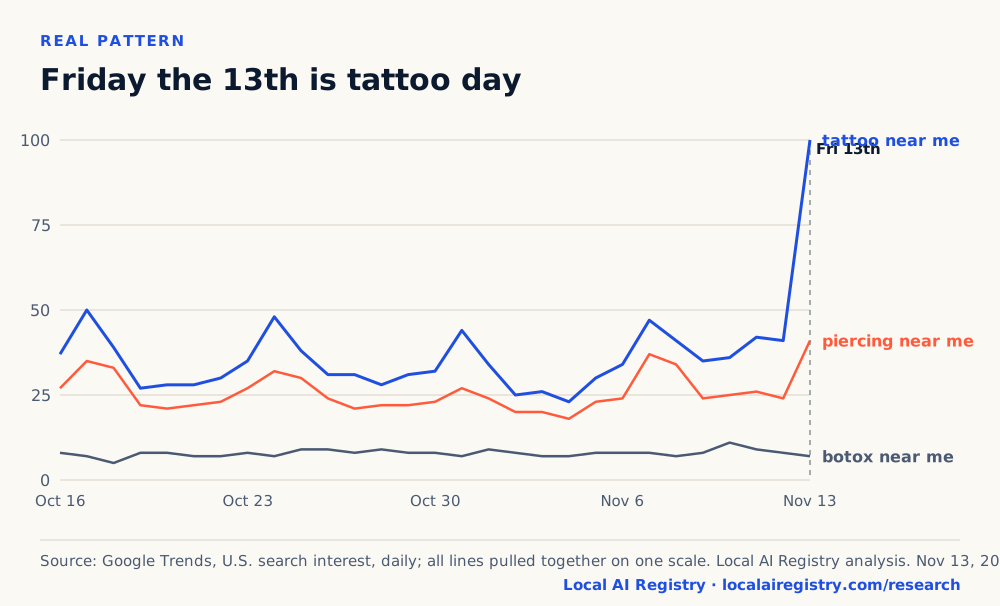
Friday the 13th is tattoo day, six for six since September 2024.
Data behind this chart
| Date | tattoo near me | piercing near me | botox near me |
|---|---|---|---|
| 2026-10-16 | 37 | 27 | 8 |
| 2026-10-17 | 50 | 35 | 7 |
| 2026-10-18 | 39 | 33 | 5 |
| 2026-10-19 | 27 | 22 | 8 |
| 2026-10-20 | 28 | 21 | 8 |
| 2026-10-21 | 28 | 22 | 7 |
| 2026-10-22 | 30 | 23 | 7 |
| 2026-10-23 | 35 | 27 | 8 |
| 2026-10-24 | 48 | 32 | 7 |
| 2026-10-25 | 38 | 30 | 9 |
| 2026-10-26 | 31 | 24 | 9 |
| 2026-10-27 | 31 | 21 | 8 |
| 2026-10-28 | 28 | 22 | 9 |
| 2026-10-29 | 31 | 22 | 8 |
| 2026-10-30 | 32 | 23 | 8 |
| 2026-10-31 | 44 | 27 | 7 |
| 2026-11-01 | 34 | 24 | 9 |
| 2026-11-02 | 25 | 20 | 8 |
| 2026-11-03 | 26 | 20 | 7 |
| 2026-11-04 | 23 | 18 | 7 |
| 2026-11-05 | 30 | 23 | 8 |
| 2026-11-06 | 34 | 24 | 8 |
| 2026-11-07 | 47 | 37 | 8 |
| 2026-11-08 | 41 | 34 | 7 |
| 2026-11-09 | 35 | 24 | 8 |
| 2026-11-10 | 36 | 25 | 11 |
| 2026-11-11 | 42 | 26 | 9 |
| 2026-11-12 | 41 | 24 | 8 |
| 2026-11-13 | 100 | 41 | 7 |
Many tattoo shops run Friday the 13th flash specials, and the searches show it. Botox and hair salon searches stayed flat on the same days.
Which local searches move together for no good reason?
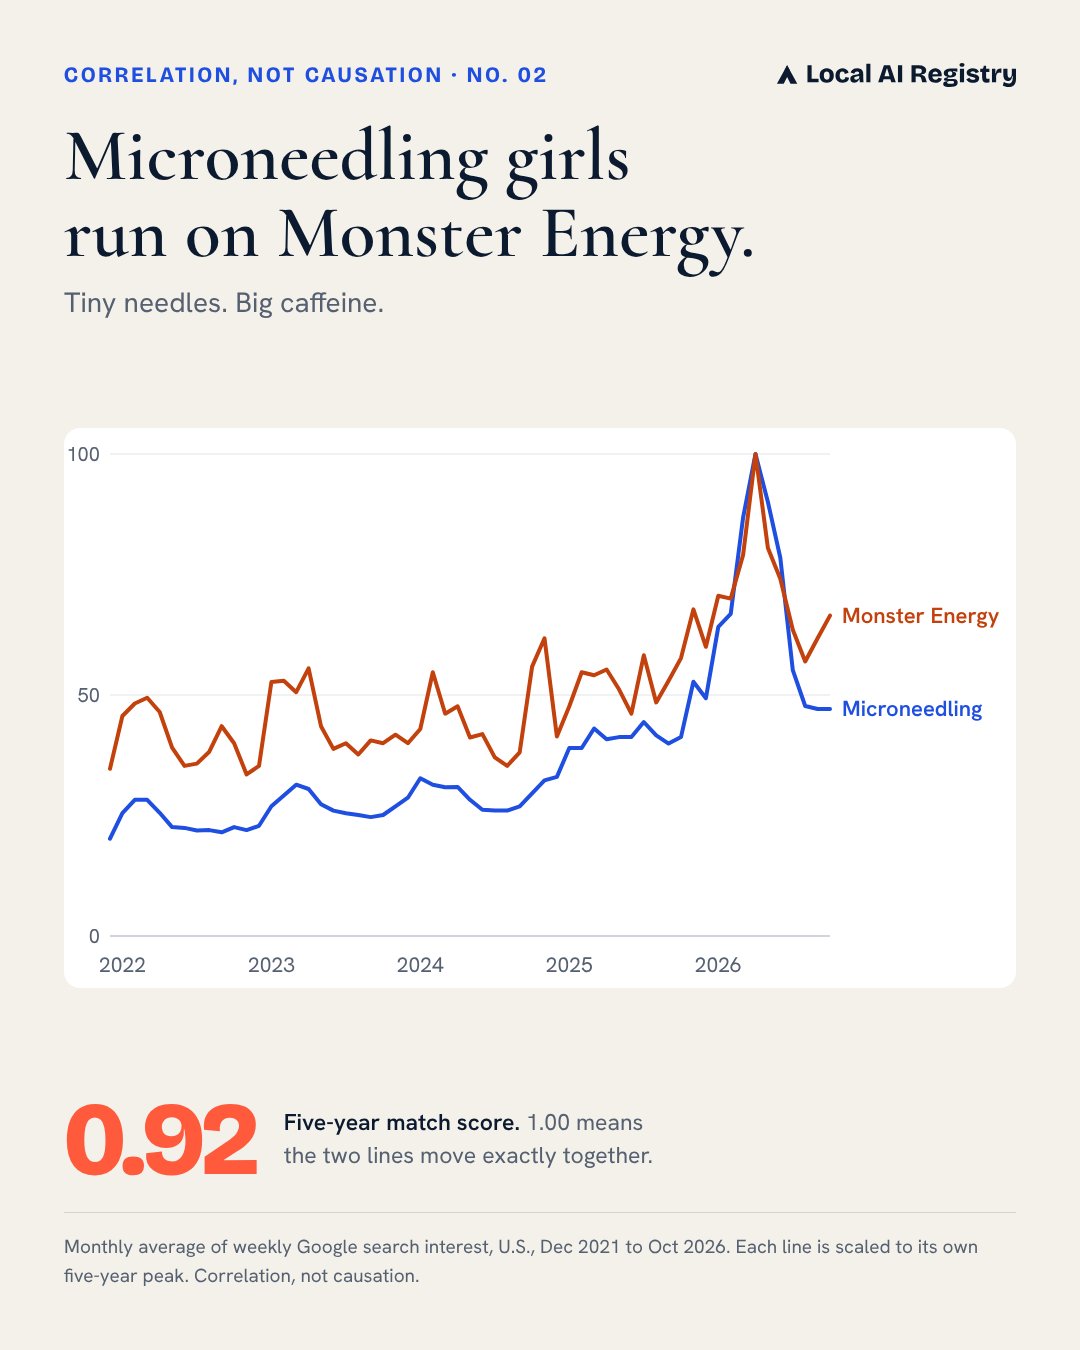
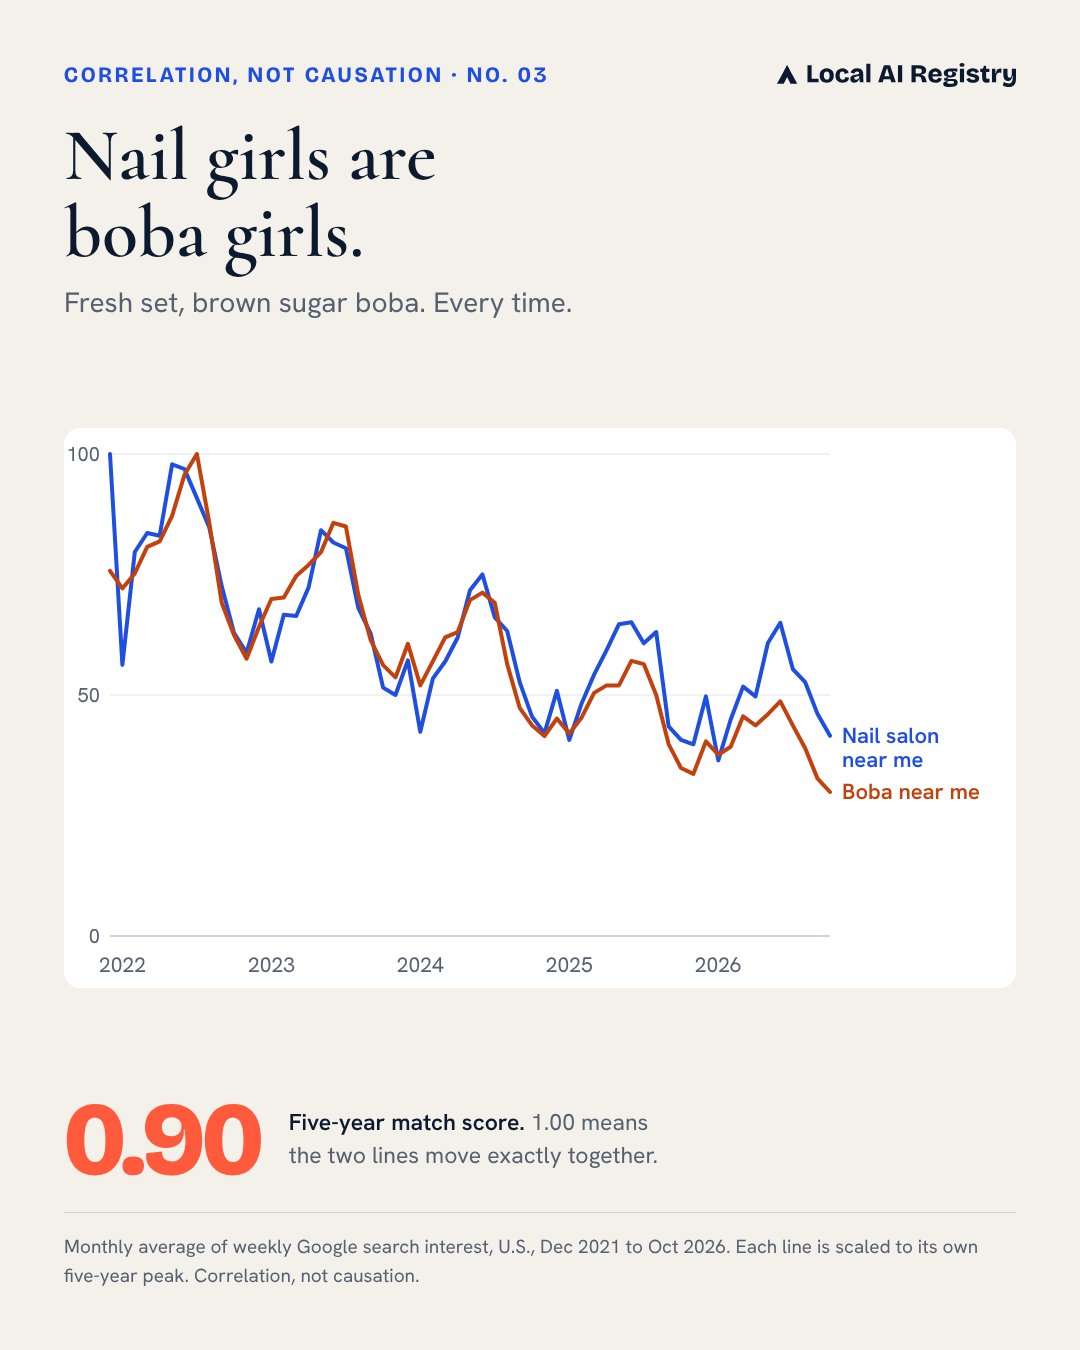
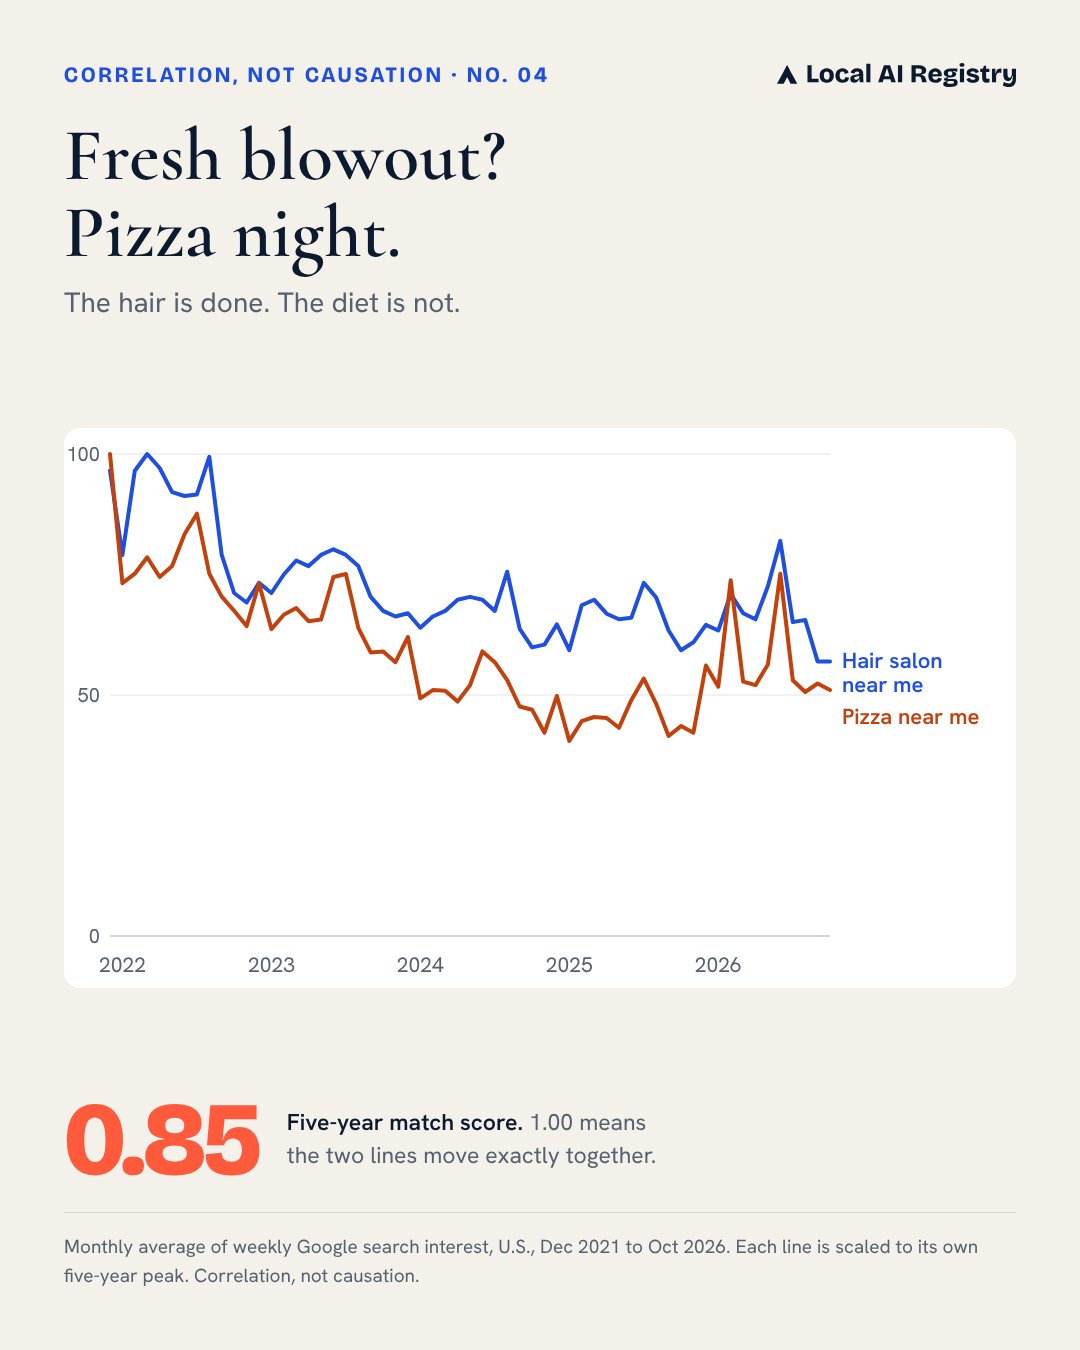
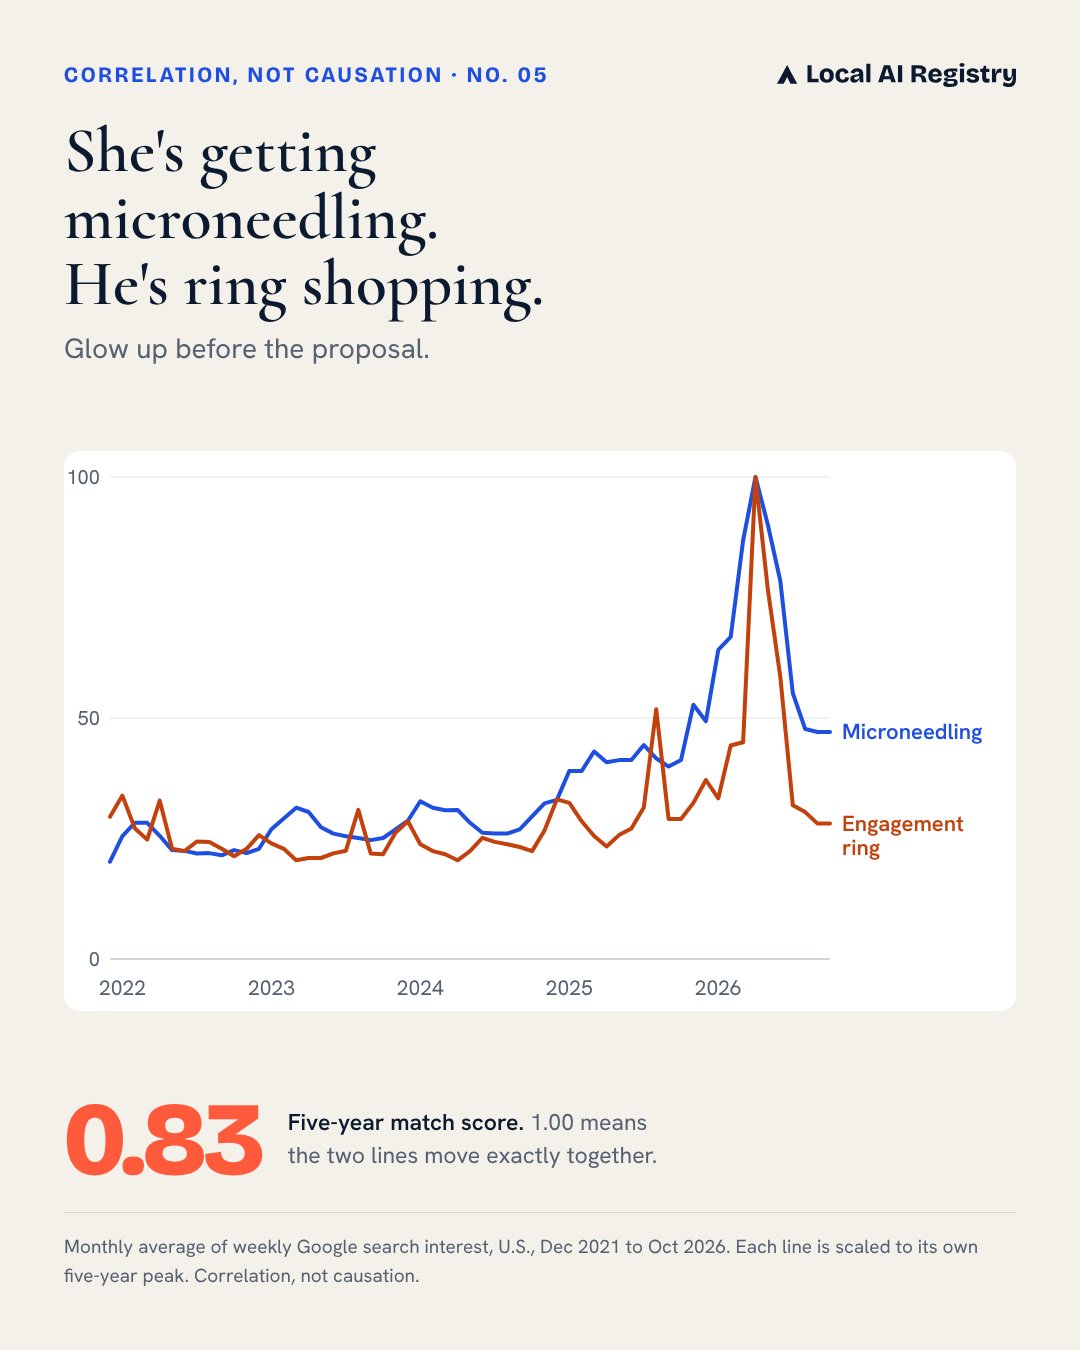
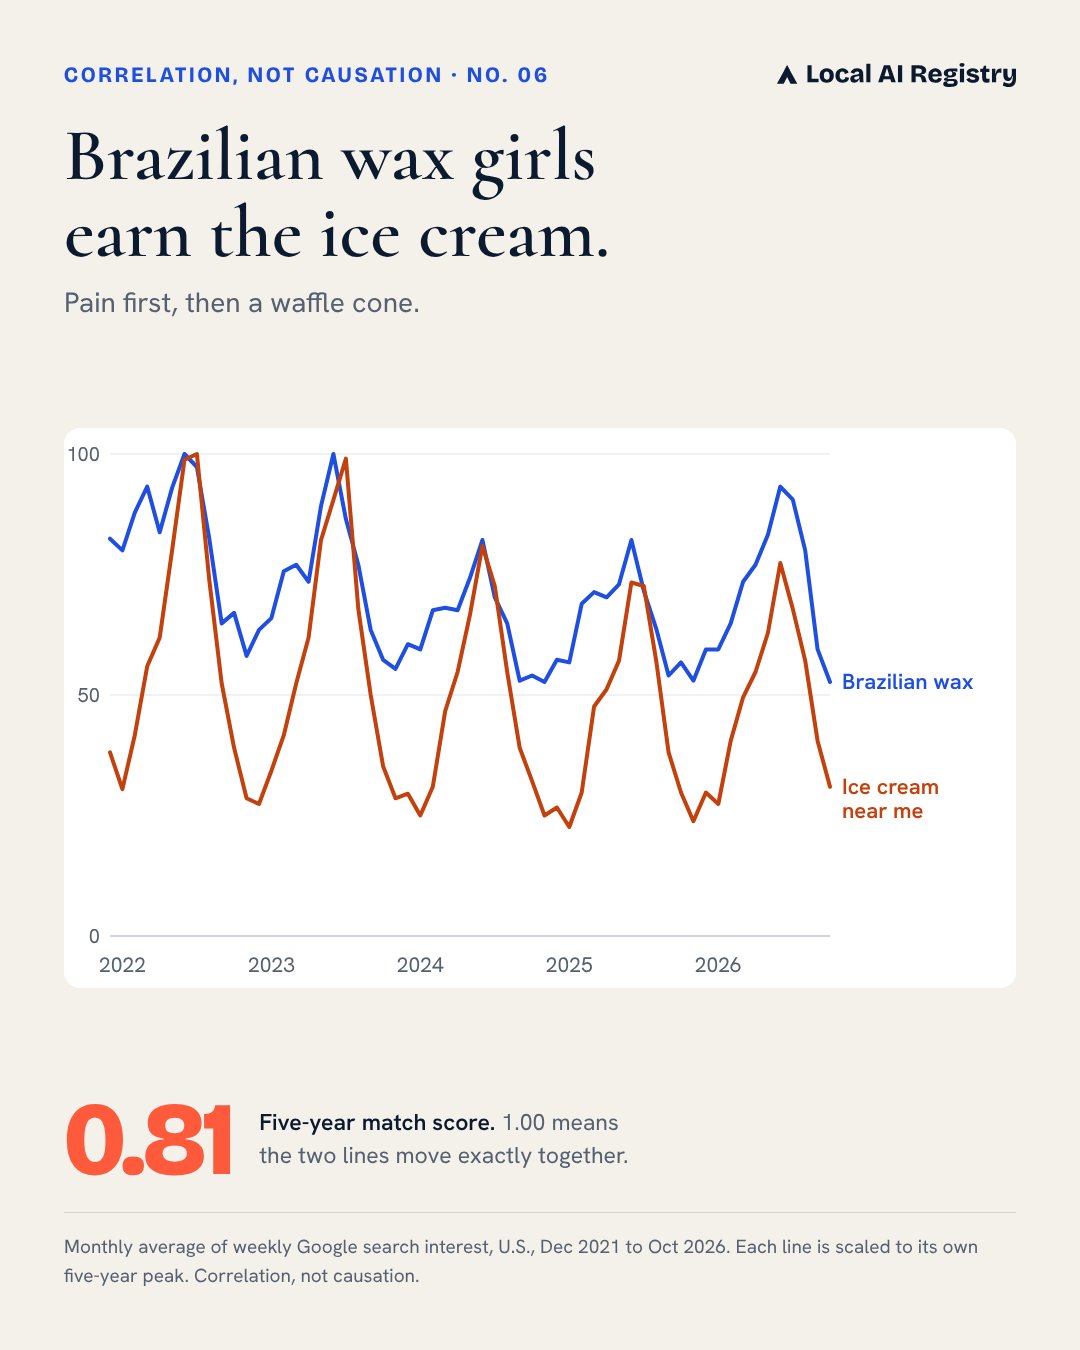
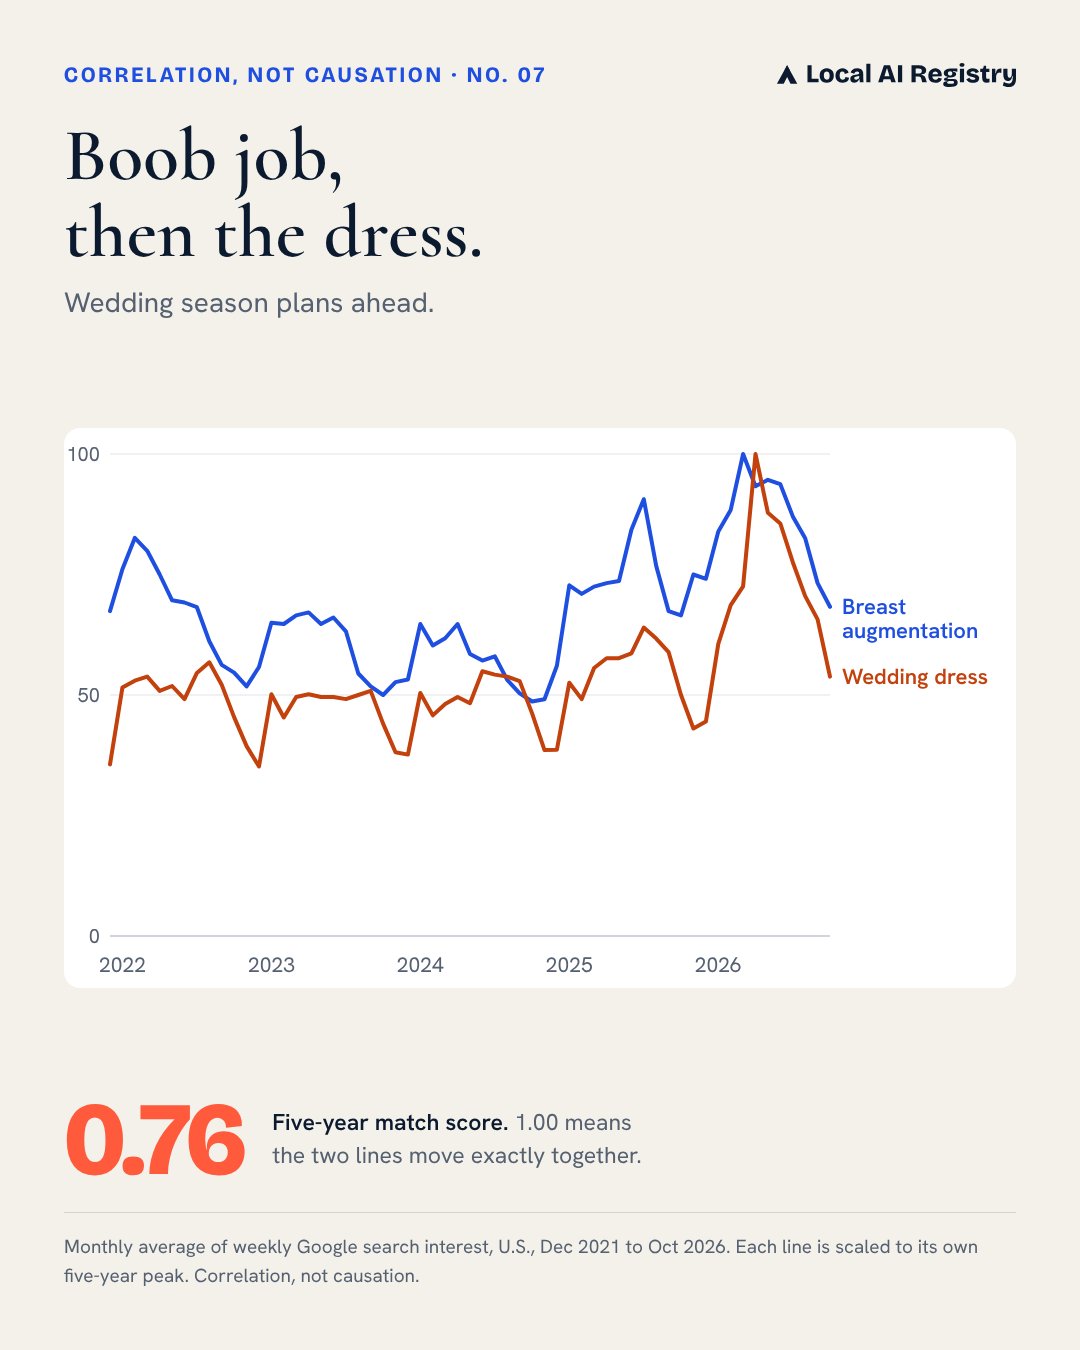
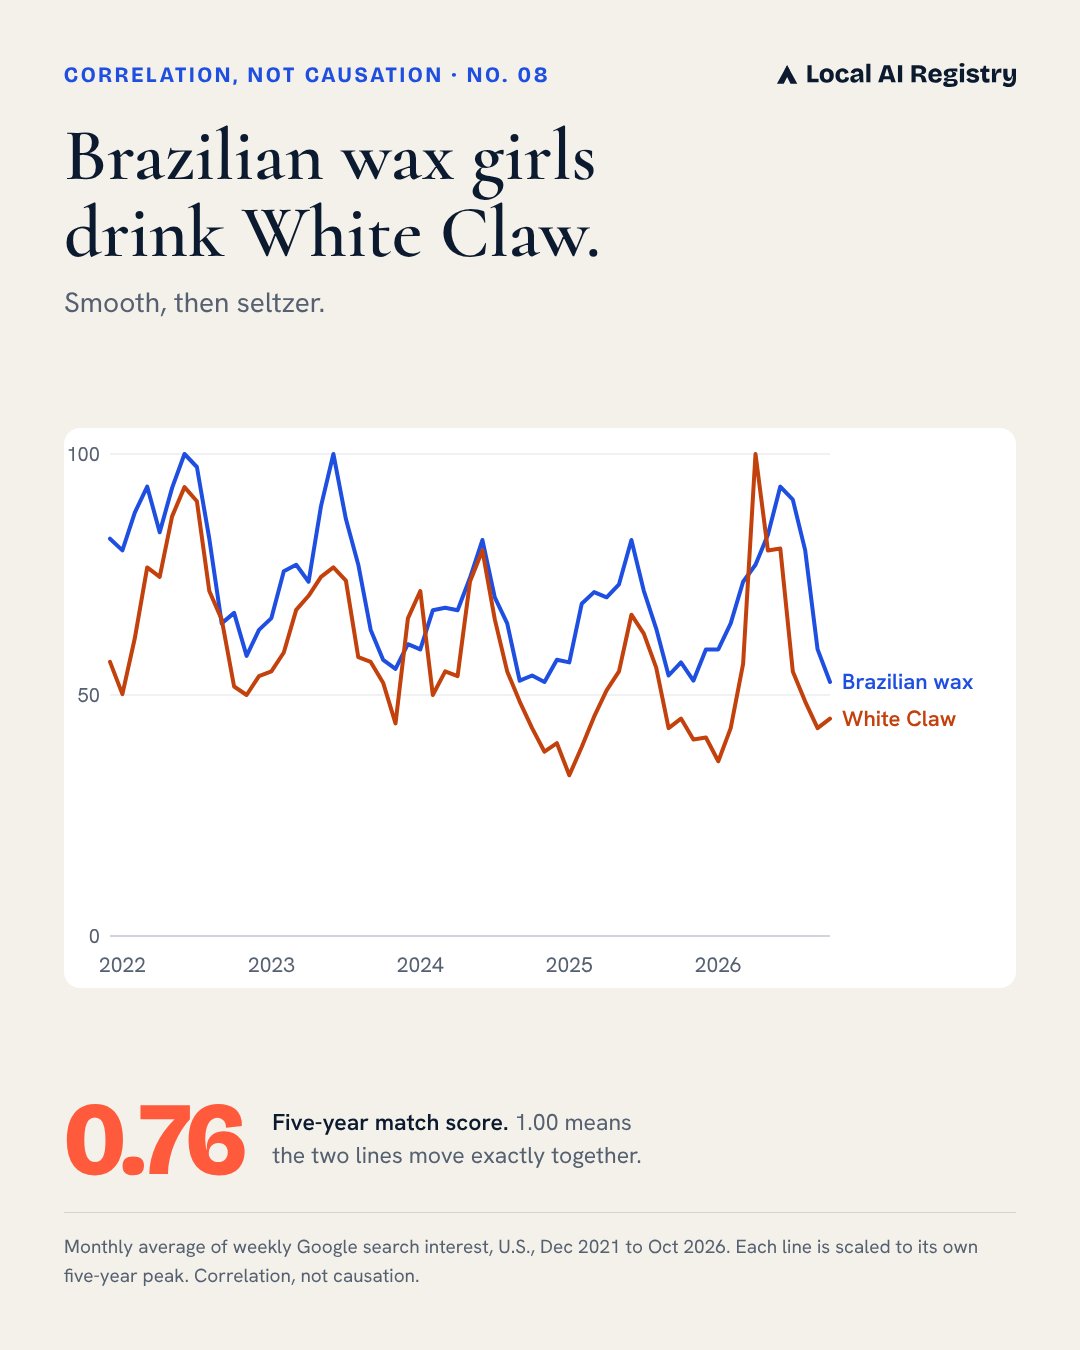
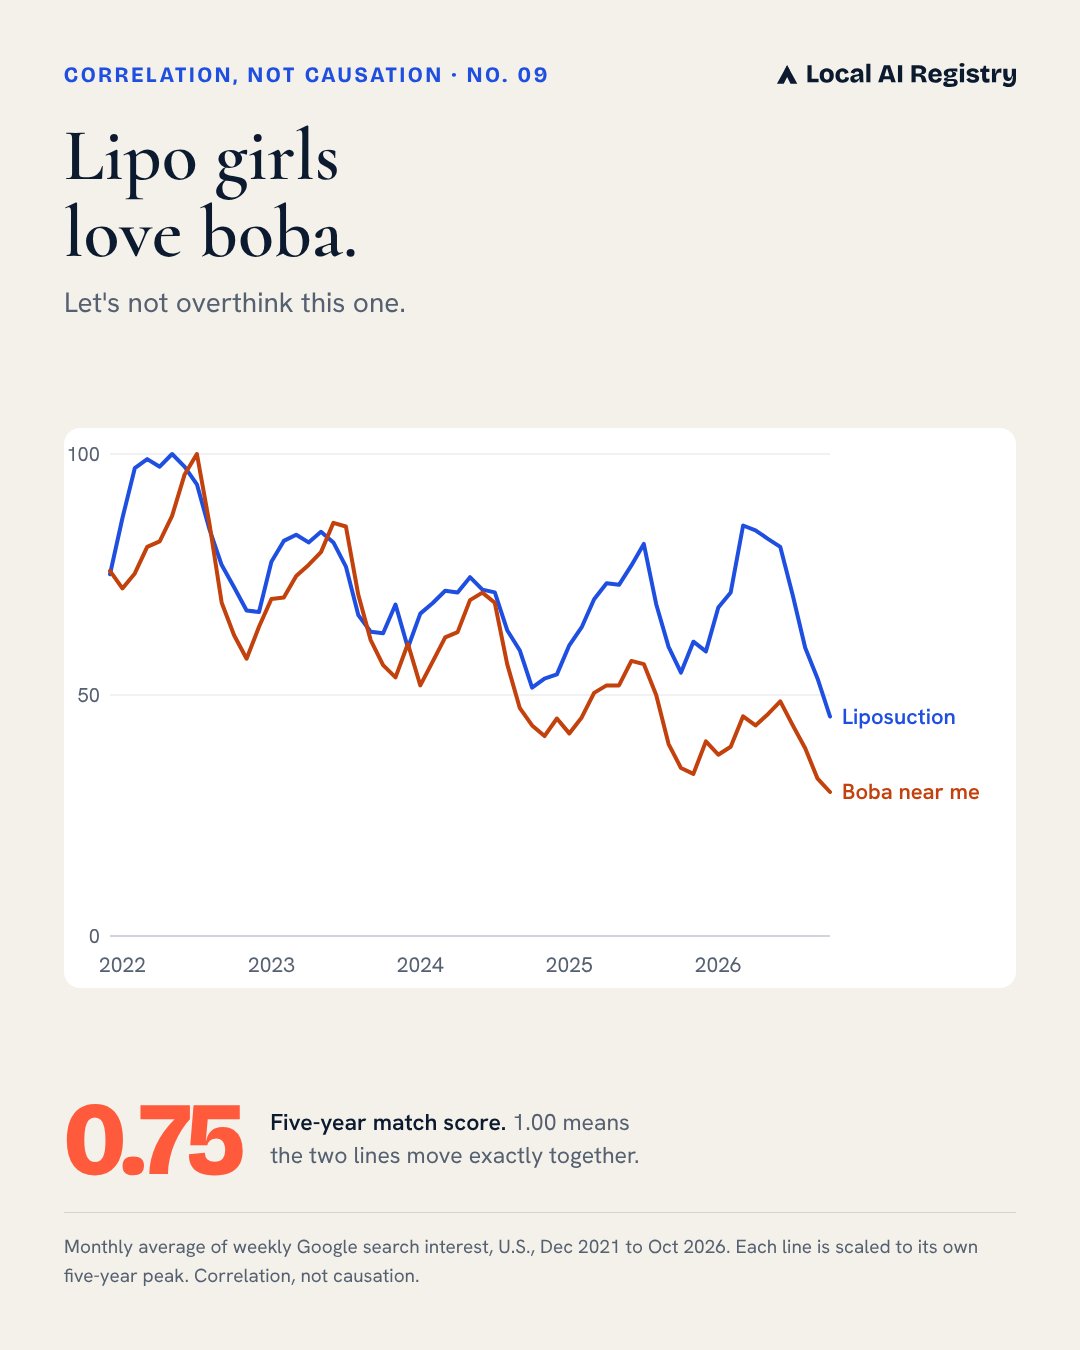
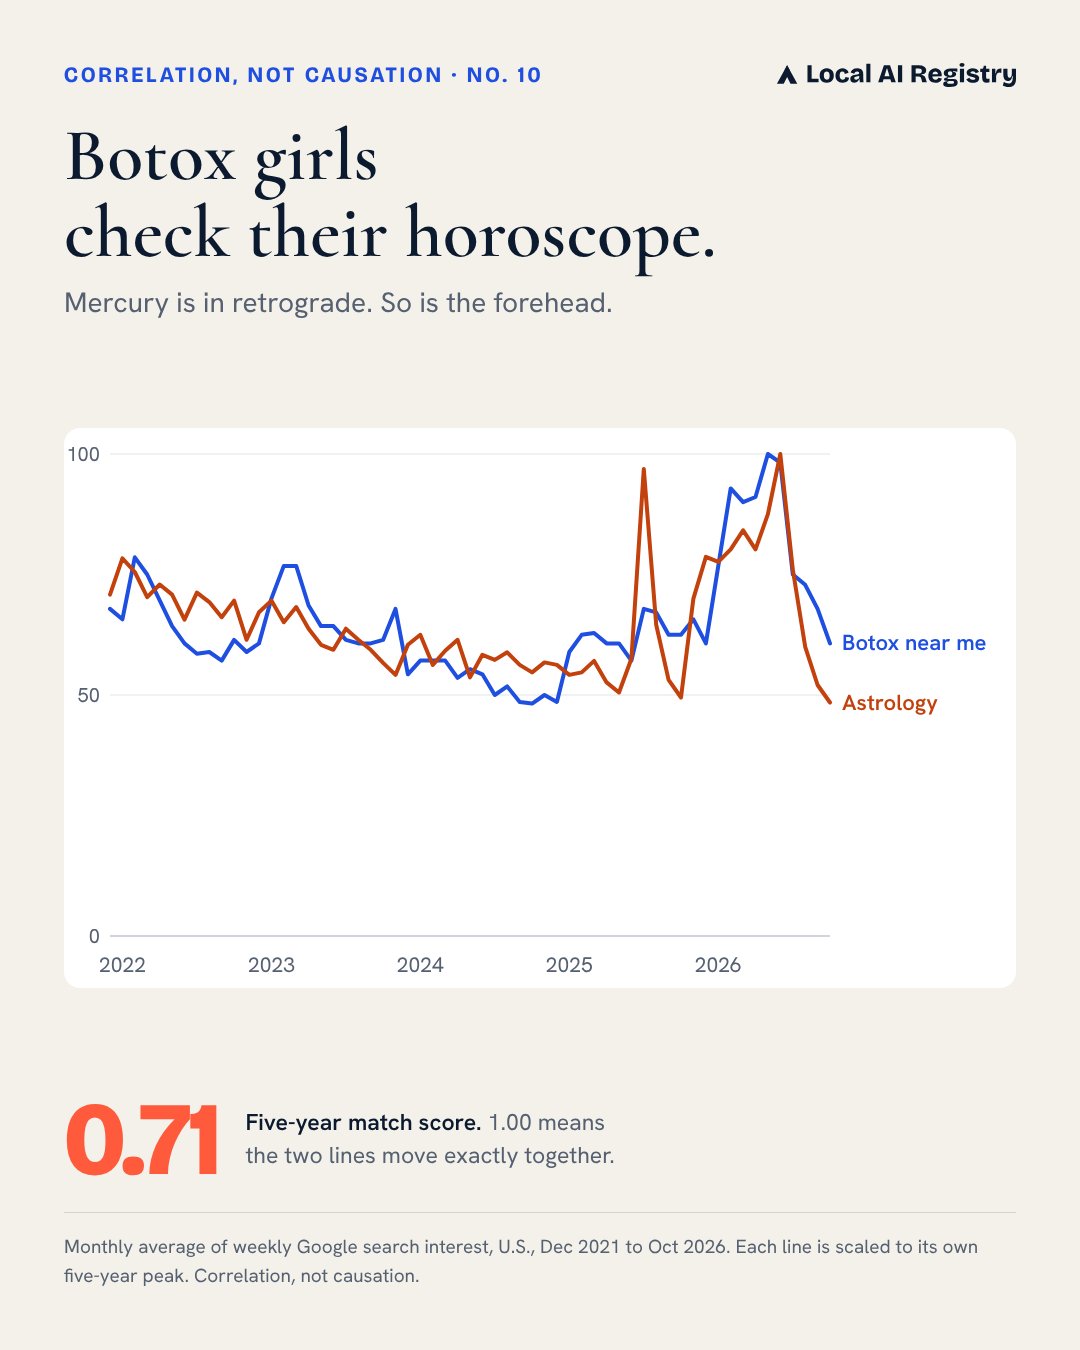
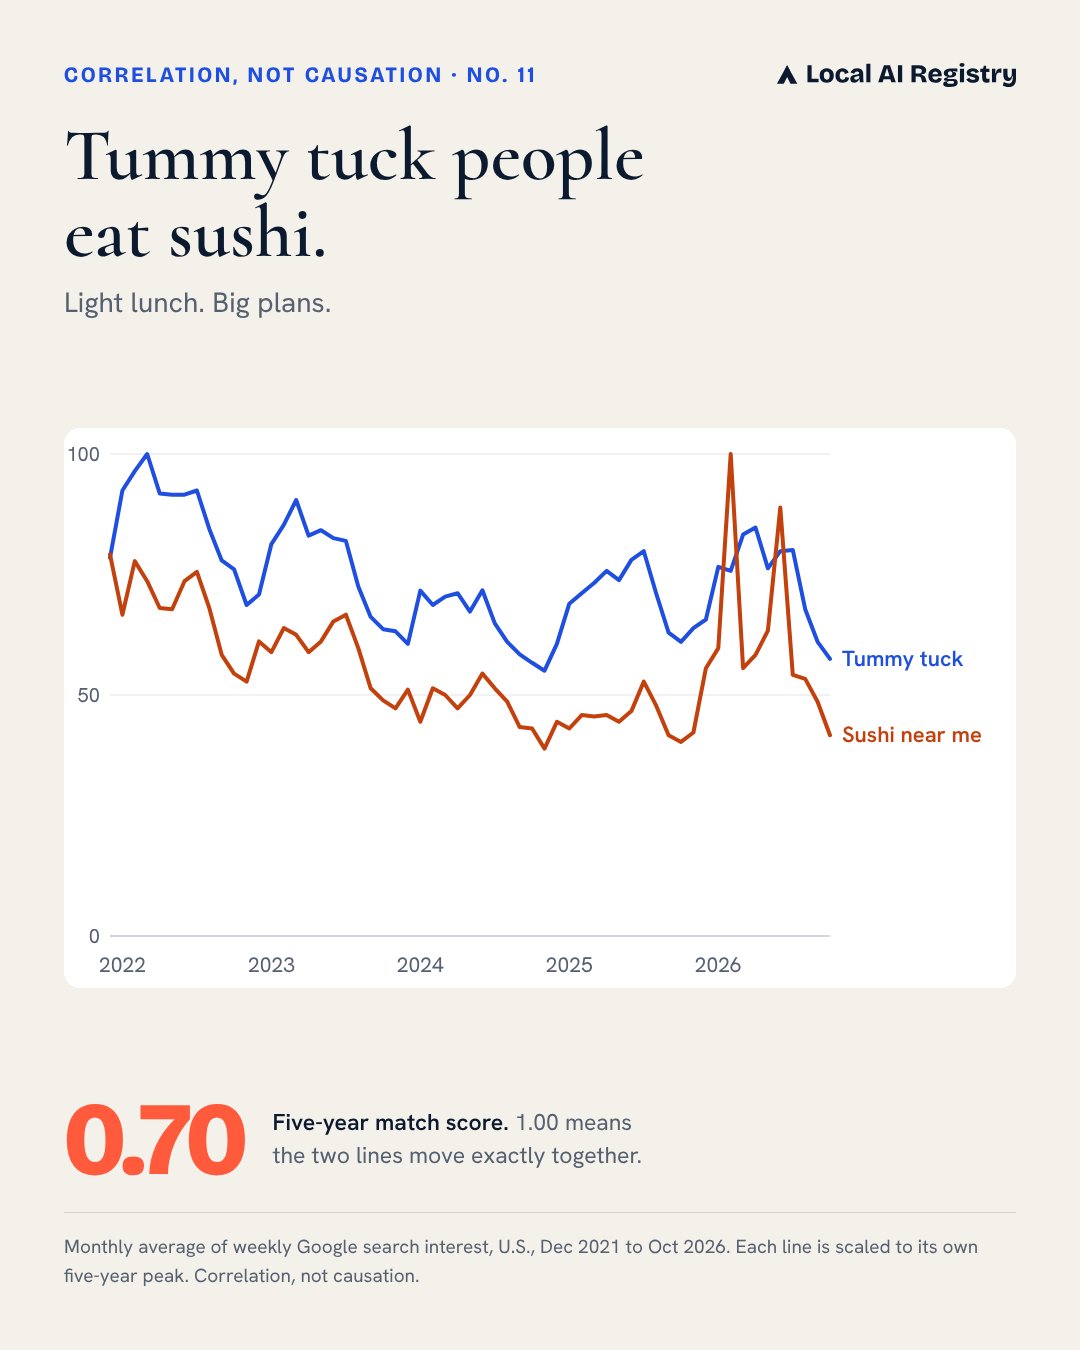
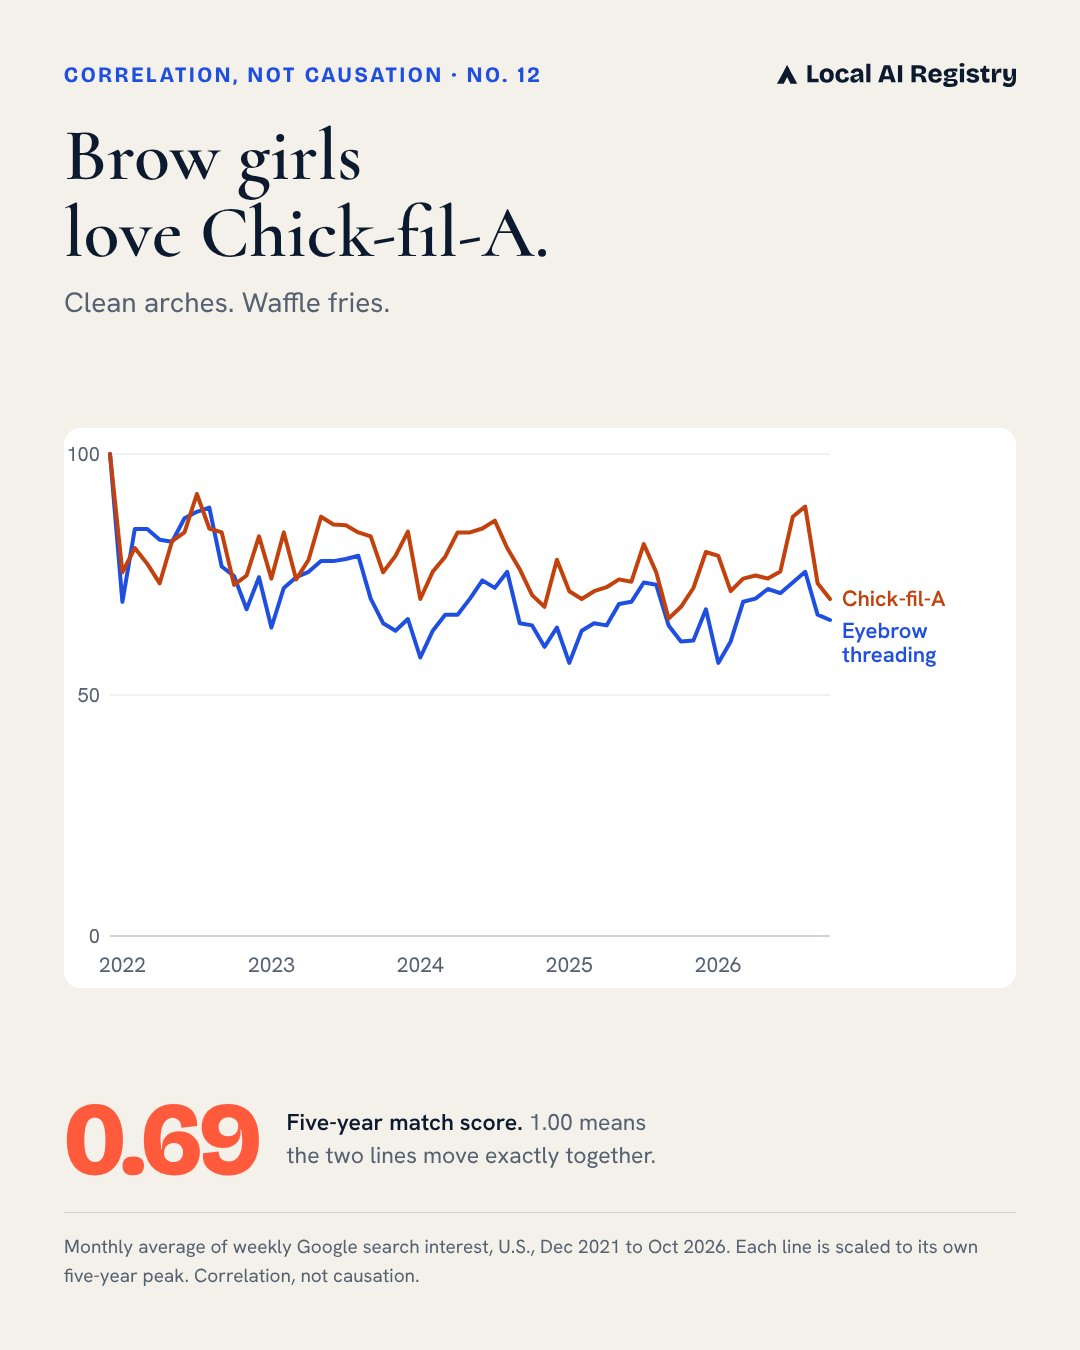
Plenty. These 14 pairs of searches have tracked each other for five years, with match scores from 0.60 to 0.94.
Monthly average of weekly U.S. Google search interest, Dec 2021 to Oct 2026. Each line is scaled to its own five-year peak. 1.00 means the two lines move exactly together.
Did the search twins hold up?
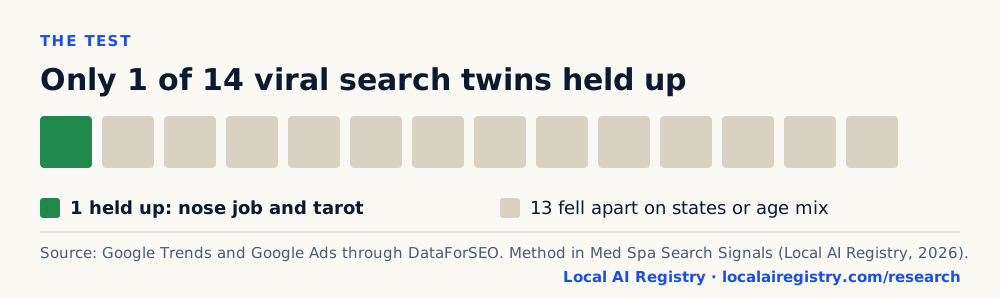
No. When we also checked states and the age mix of searchers, 13 of the 14 fell apart. Nose job and tarot held up.
Data behind this chart
| Viral pairs | Pairs |
|---|---|
| Held up on all three tests | 1 |
| Fell apart | 13 |
A matching chart is only the first test. Two searches that share an audience should also be big in the same states and searched by people of the same age. In a wider test of 680 beauty and everyday pairs, only two passed everything: nose job with tarot, and Botox with wedding dress. The full method is in Med Spa Search Signals.
Which states search for the same things?
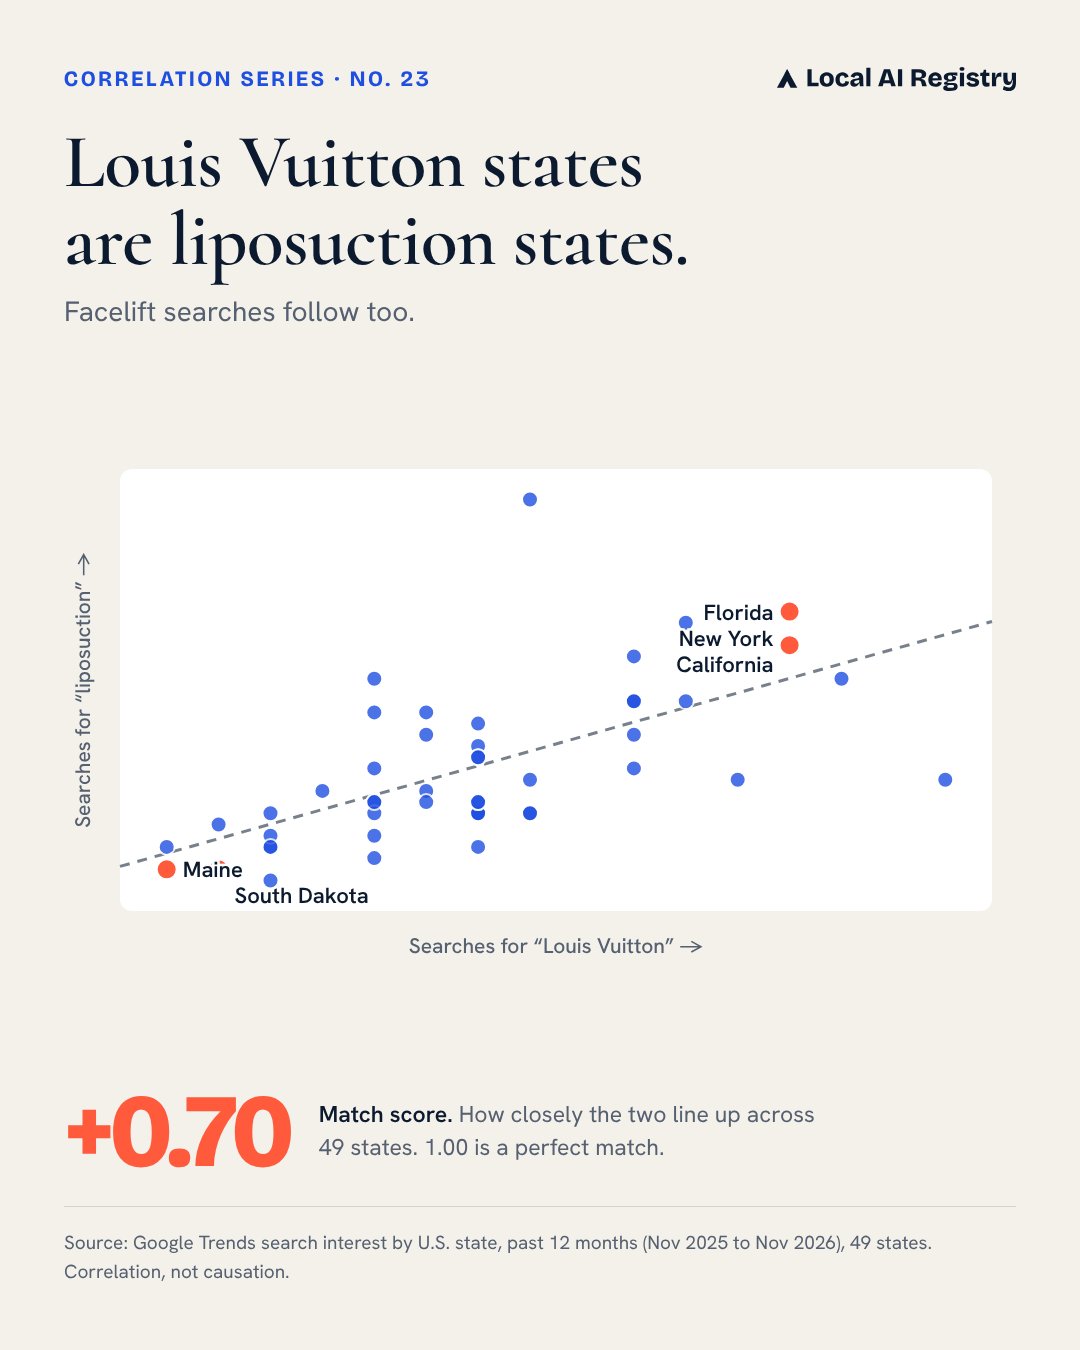
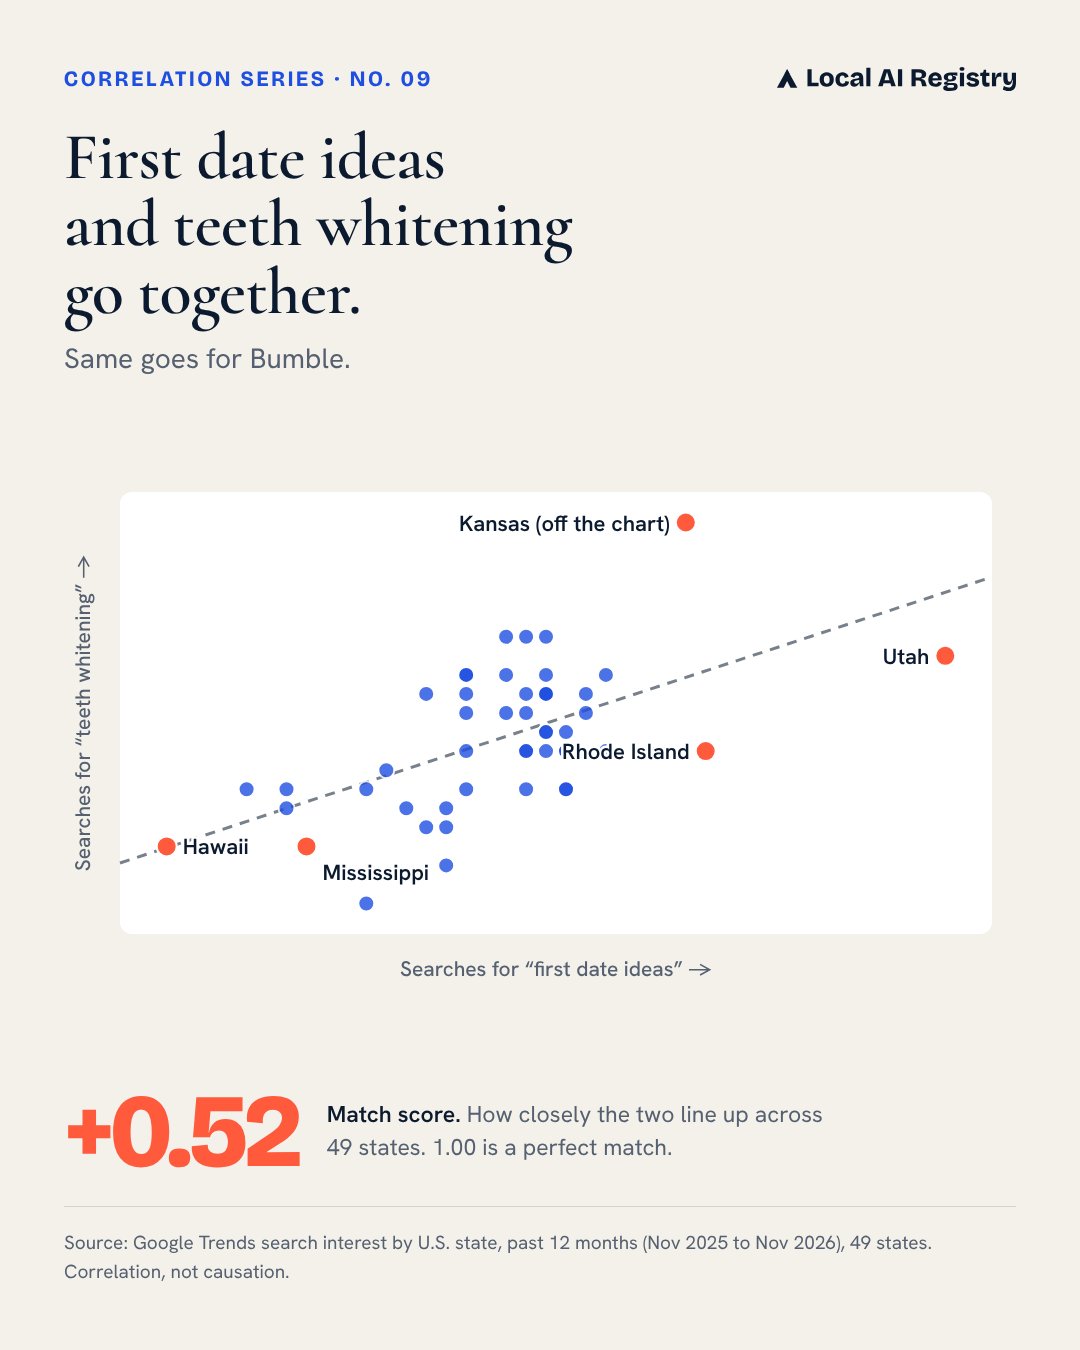
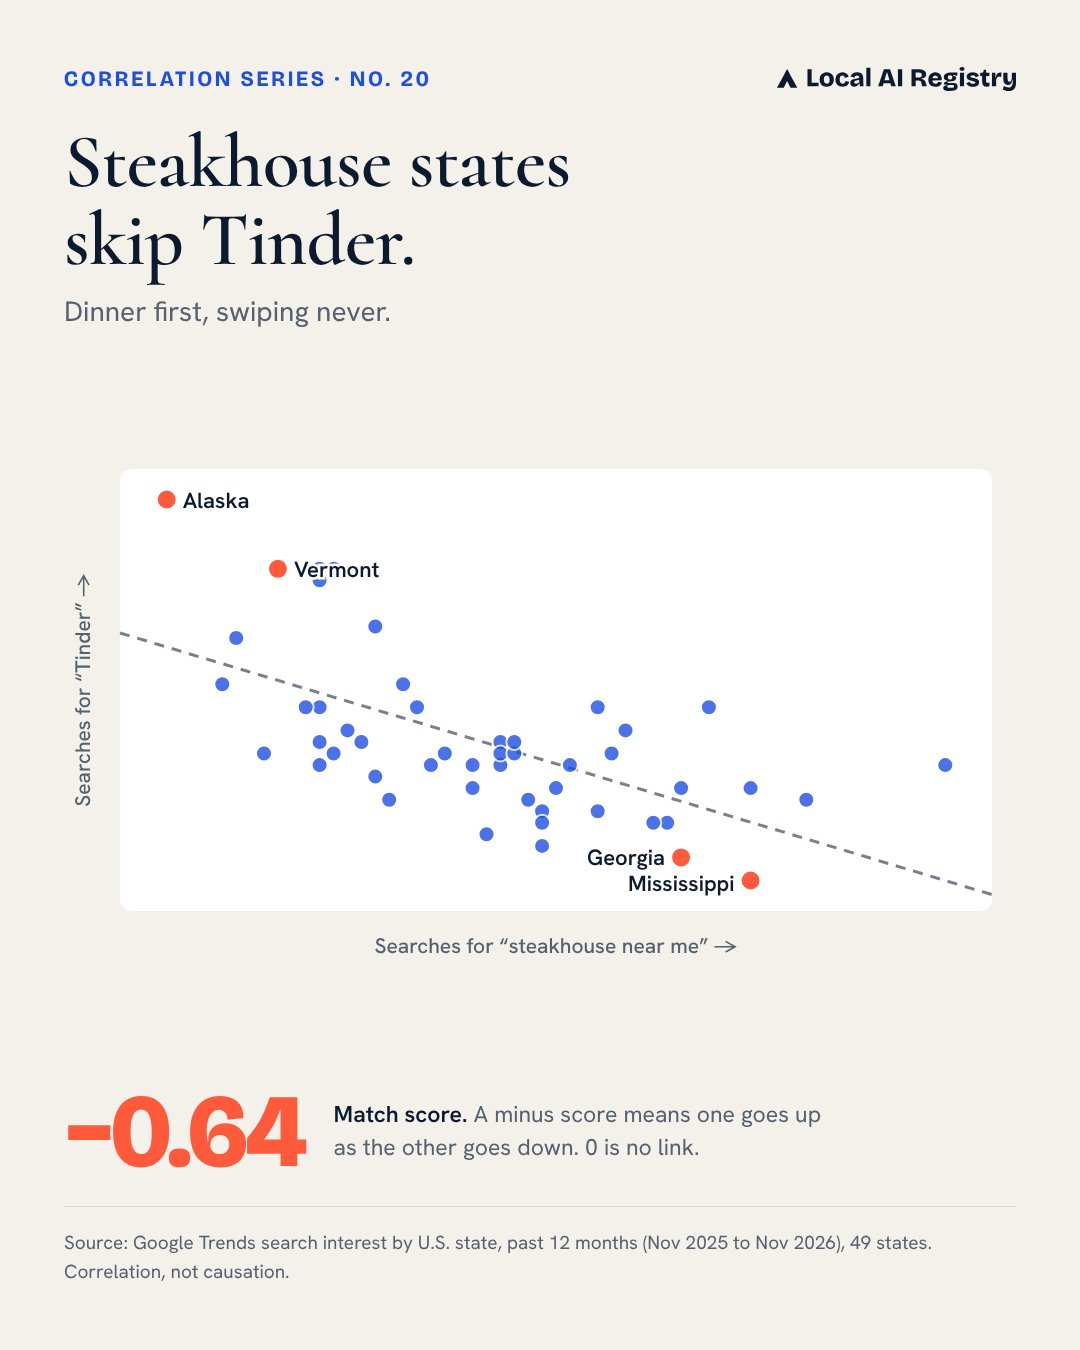
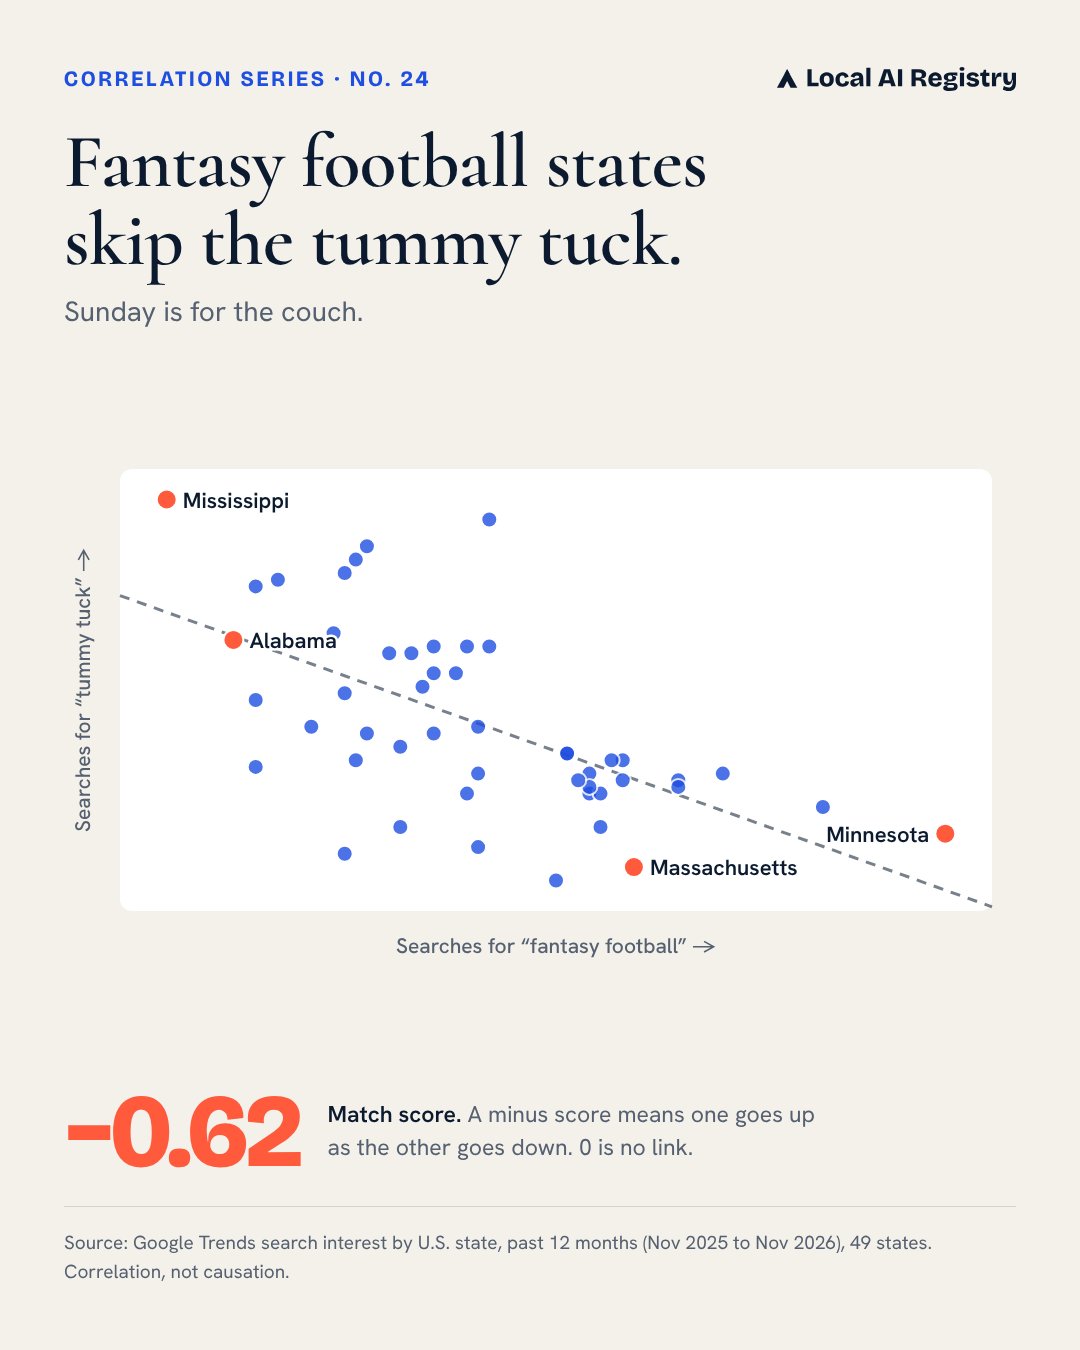
Luxury states are facelift states. Tesla, Rolex, sushi and Louis Vuitton all rank states almost the same way facelift searches do.
The likely real link is a hidden third factor: income and city life push all of these searches up in the same places. That makes these maps fun, and also useful for knowing where demand is, as long as nobody reads them as cause and effect.
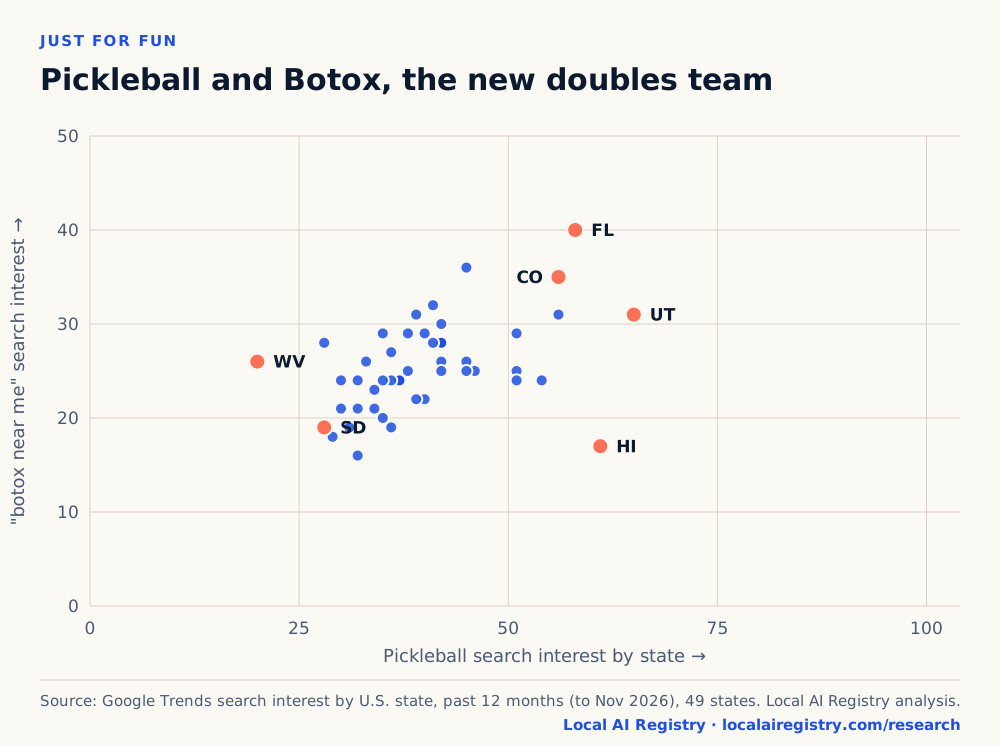
Google Trends search interest by U.S. state, Nov 2025 to Nov 2026, 49 states. Match scores compare how the states rank. A minus score means one goes up as the other goes down.
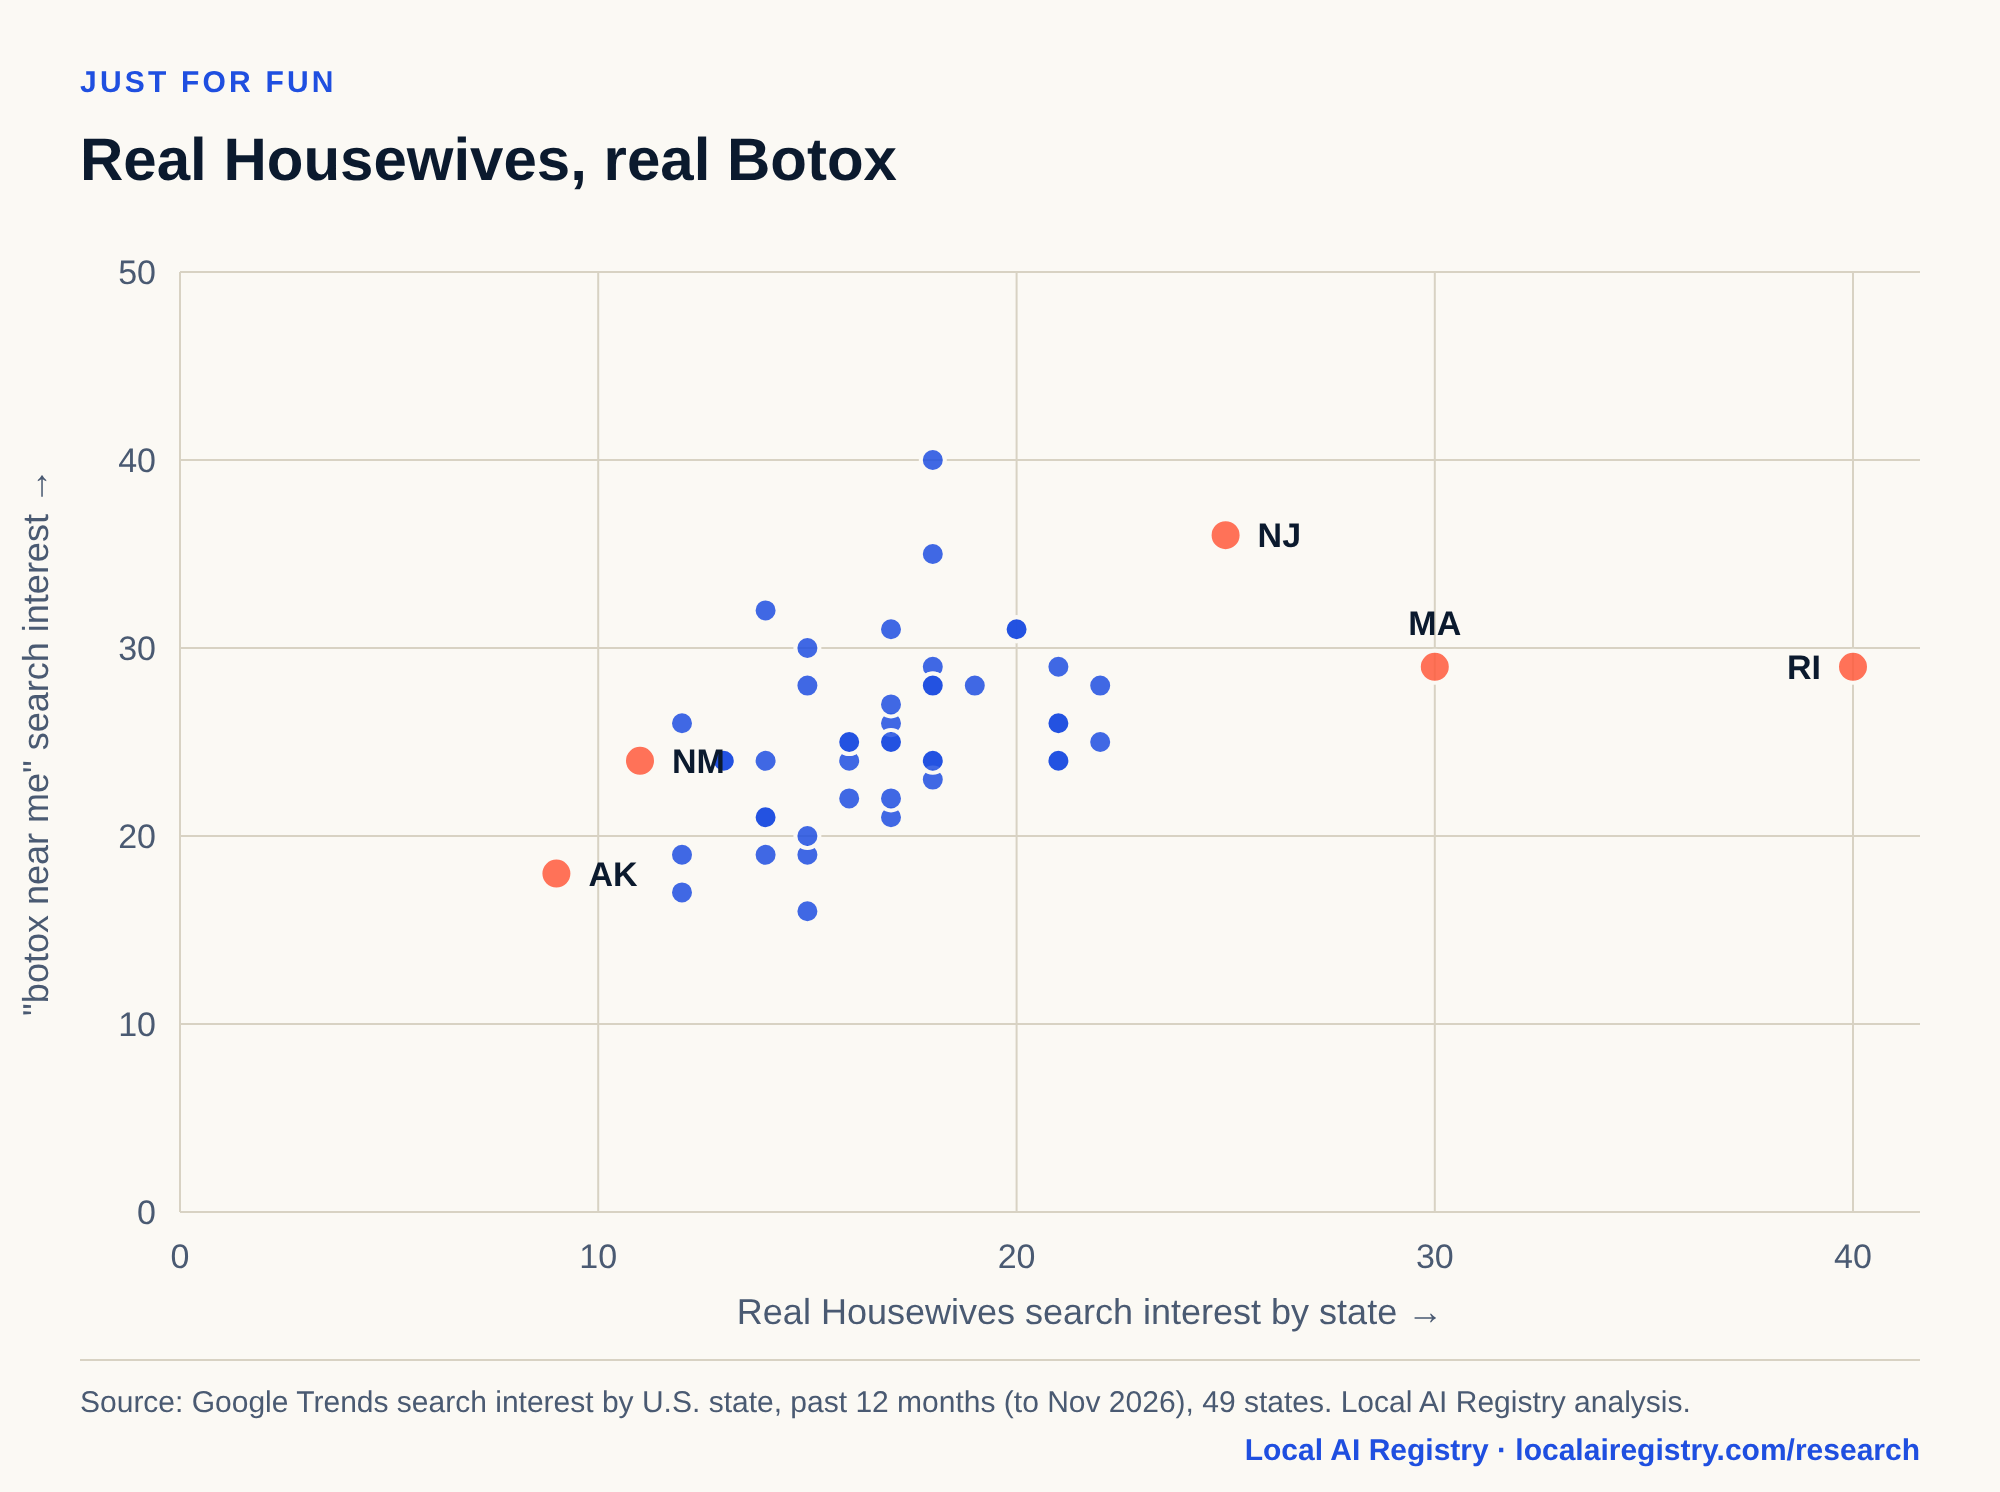
Data behind this chart
| State | Real Housewives search interest | botox near me search interest |
|---|---|---|
| RI | 100 | 29 |
| MA | 30 | 29 |
| NJ | 25 | 36 |
| CT | 22 | 28 |
| DE | 22 | 25 |
| NY | 21 | 29 |
| IL | 21 | 24 |
| MD | 21 | 24 |
| PA | 21 | 26 |
| GA | 21 | 26 |
| NH | 20 | 31 |
| UT | 20 | 31 |
| VA | 19 | 28 |
| CA | 18 | 29 |
| SC | 18 | 28 |
| CO | 18 | 35 |
| FL | 18 | 40 |
| VT | 18 | 24 |
| LA | 18 | 23 |
| MI | 18 | 28 |
| MN | 18 | 24 |
| WA | 17 | 25 |
| TN | 17 | 26 |
| NC | 17 | 25 |
| ME | 17 | 21 |
| MO | 17 | 22 |
| OH | 17 | 27 |
| AZ | 17 | 31 |
| NV | 16 | 24 |
| TX | 16 | 25 |
| WI | 16 | 22 |
| OR | 16 | 25 |
| ID | 15 | 30 |
| AR | 15 | 19 |
| MT | 15 | 16 |
| NE | 15 | 20 |
| MS | 15 | 28 |
| IA | 14 | 21 |
| KS | 14 | 32 |
| AL | 14 | 24 |
| OK | 14 | 19 |
| IN | 14 | 21 |
| ND | 13 | 24 |
| KY | 13 | 24 |
| SD | 12 | 19 |
| HI | 12 | 17 |
| WV | 12 | 26 |
| NM | 11 | 24 |
| AK | 9 | 18 |
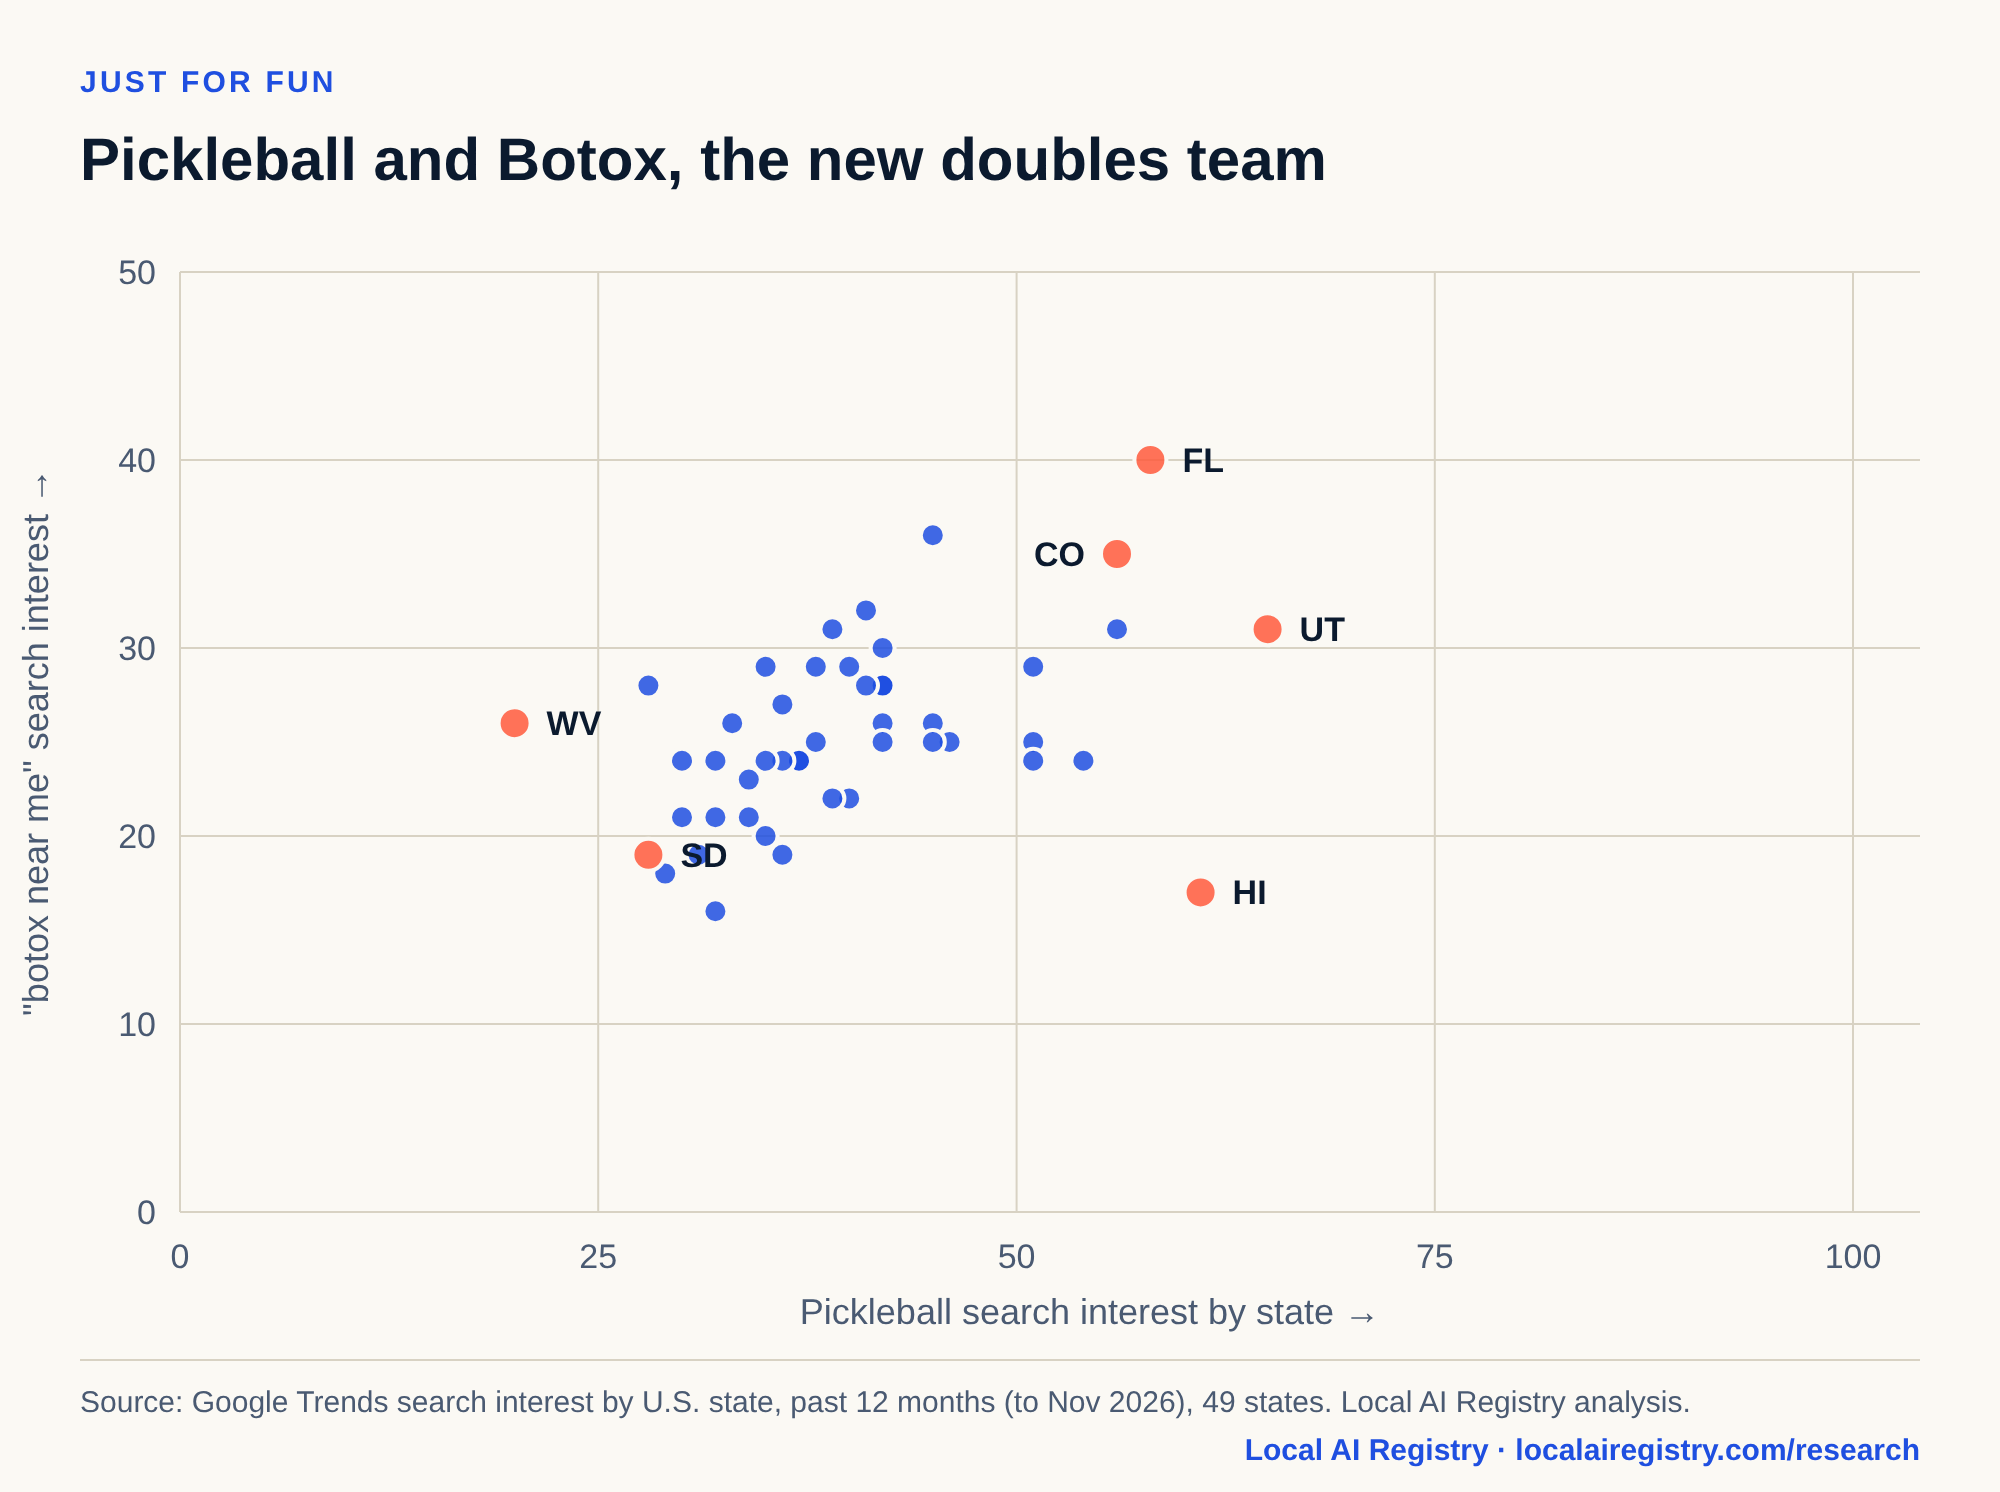
Data behind this chart
| State | pickleball search interest | botox near me search interest |
|---|---|---|
| UT | 65 | 31 |
| HI | 61 | 17 |
| FL | 58 | 40 |
| CO | 56 | 35 |
| AZ | 56 | 31 |
| MN | 54 | 24 |
| WA | 51 | 25 |
| CA | 51 | 29 |
| NV | 51 | 24 |
| NC | 46 | 25 |
| GA | 45 | 26 |
| TX | 45 | 25 |
| NJ | 45 | 36 |
| CT | 42 | 28 |
| SC | 42 | 28 |
| TN | 42 | 26 |
| OR | 42 | 25 |
| ID | 42 | 30 |
| MI | 42 | 28 |
| KS | 41 | 32 |
| VA | 41 | 28 |
| MA | 40 | 29 |
| MO | 40 | 22 |
| NH | 39 | 31 |
| WI | 39 | 22 |
| DE | 38 | 25 |
| NY | 38 | 29 |
| IL | 37 | 24 |
| VT | 37 | 24 |
| MD | 37 | 24 |
| AR | 36 | 19 |
| AL | 36 | 24 |
| OH | 36 | 27 |
| NE | 35 | 20 |
| NM | 35 | 24 |
| RI | 35 | 29 |
| LA | 34 | 23 |
| IN | 34 | 21 |
| PA | 33 | 26 |
| KY | 32 | 24 |
| MT | 32 | 16 |
| IA | 32 | 21 |
| OK | 31 | 19 |
| ME | 30 | 21 |
| ND | 30 | 24 |
| AK | 29 | 18 |
| MS | 28 | 28 |
| SD | 28 | 19 |
| WV | 20 | 26 |
Data behind this chart
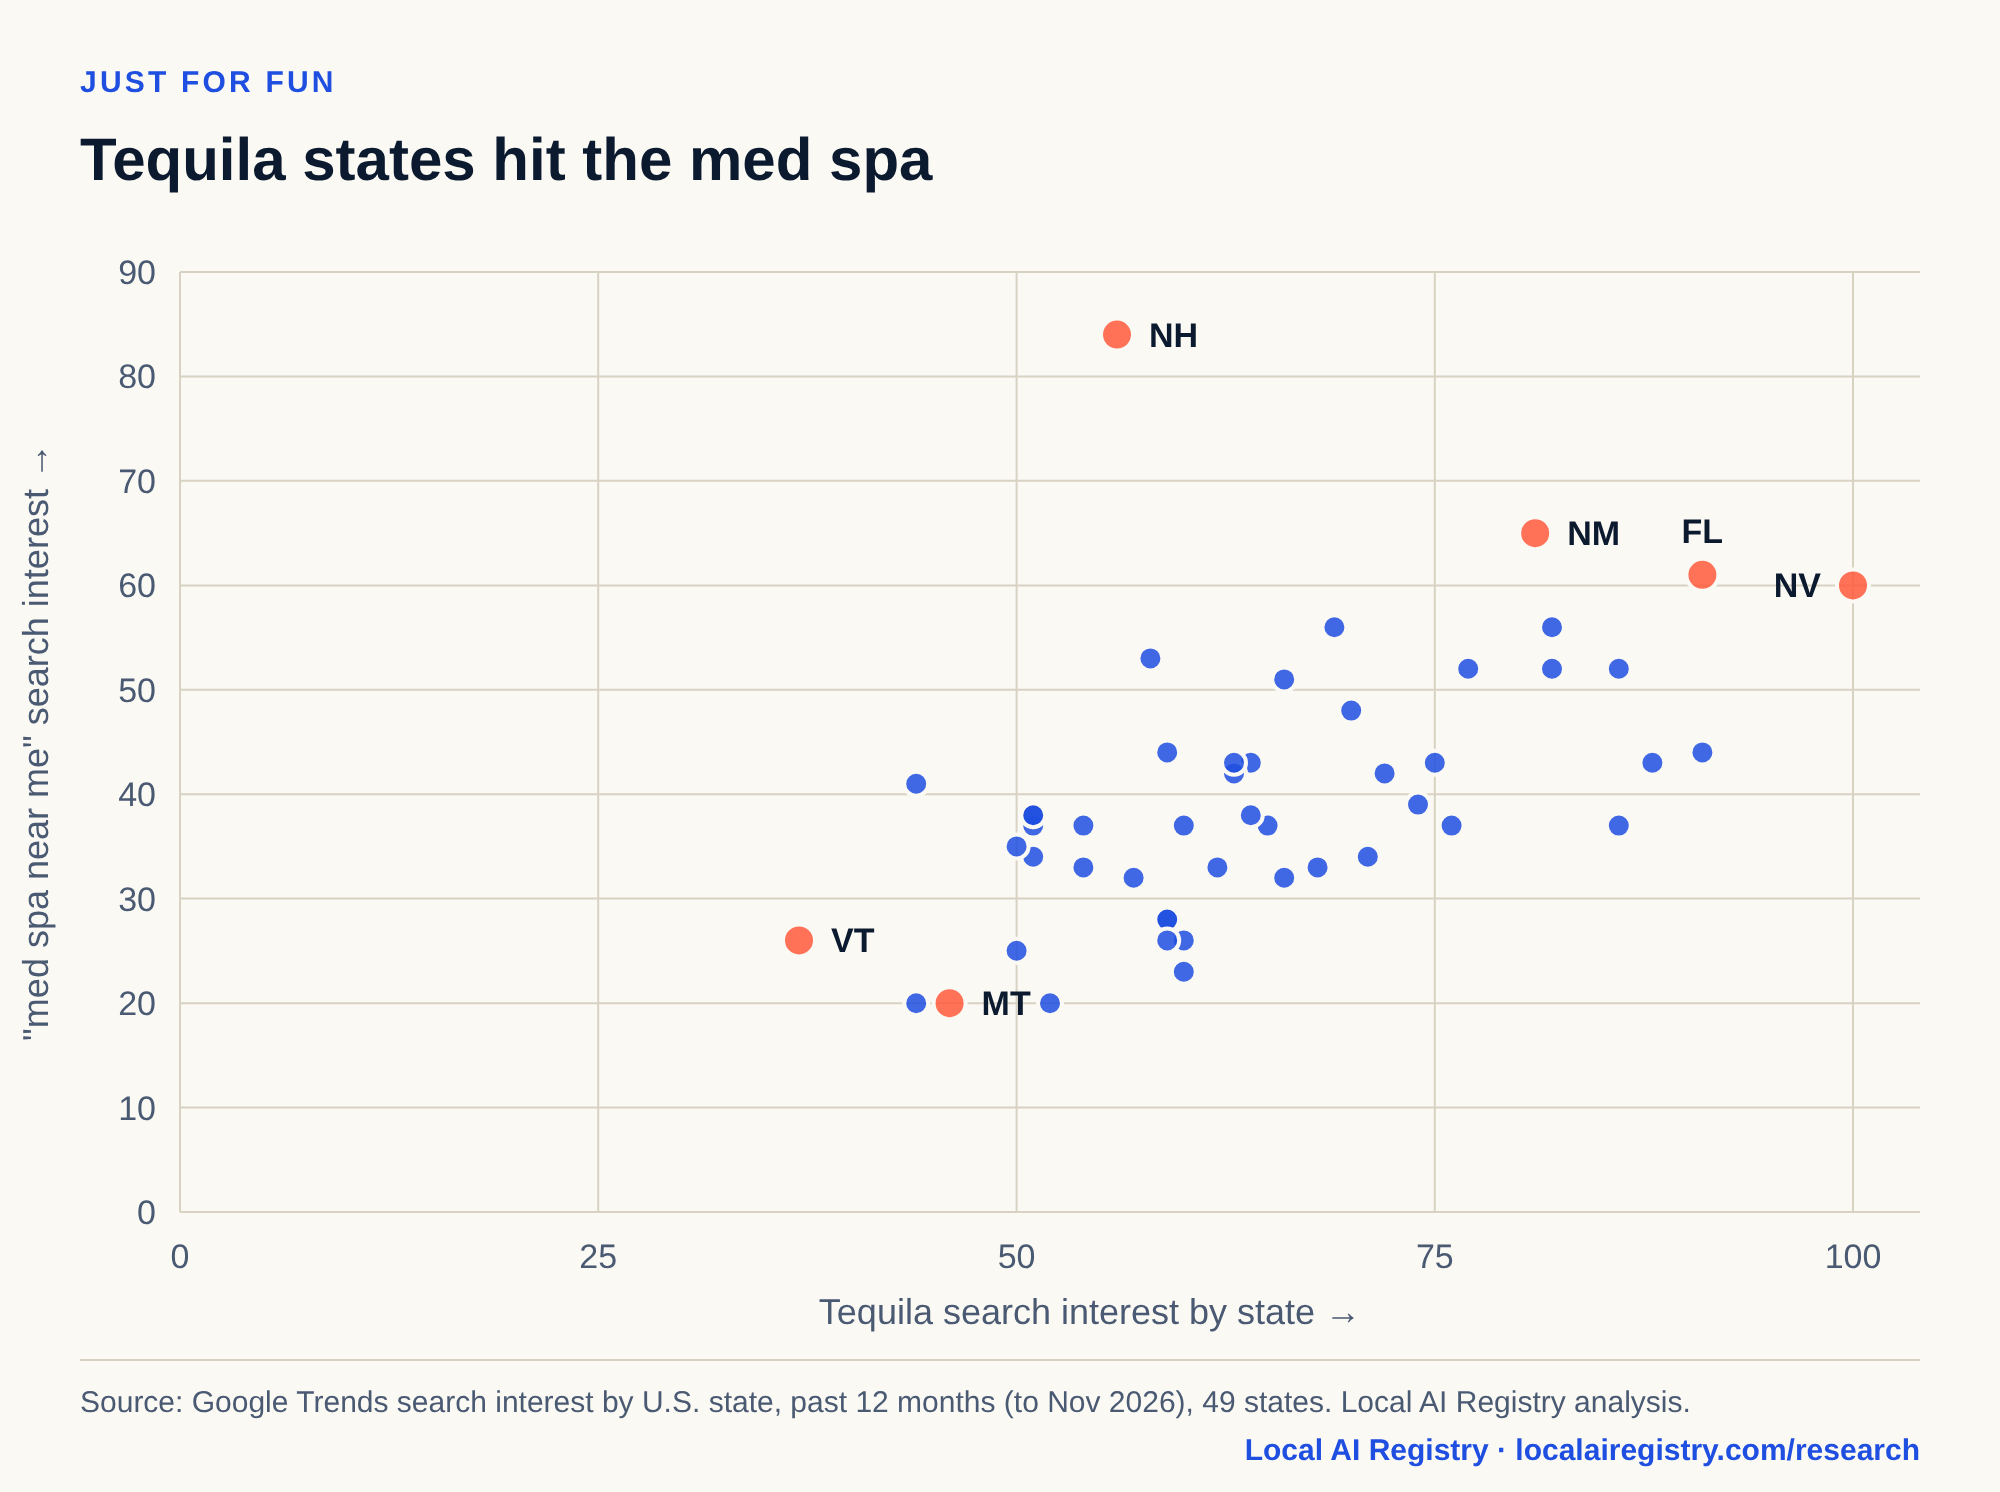
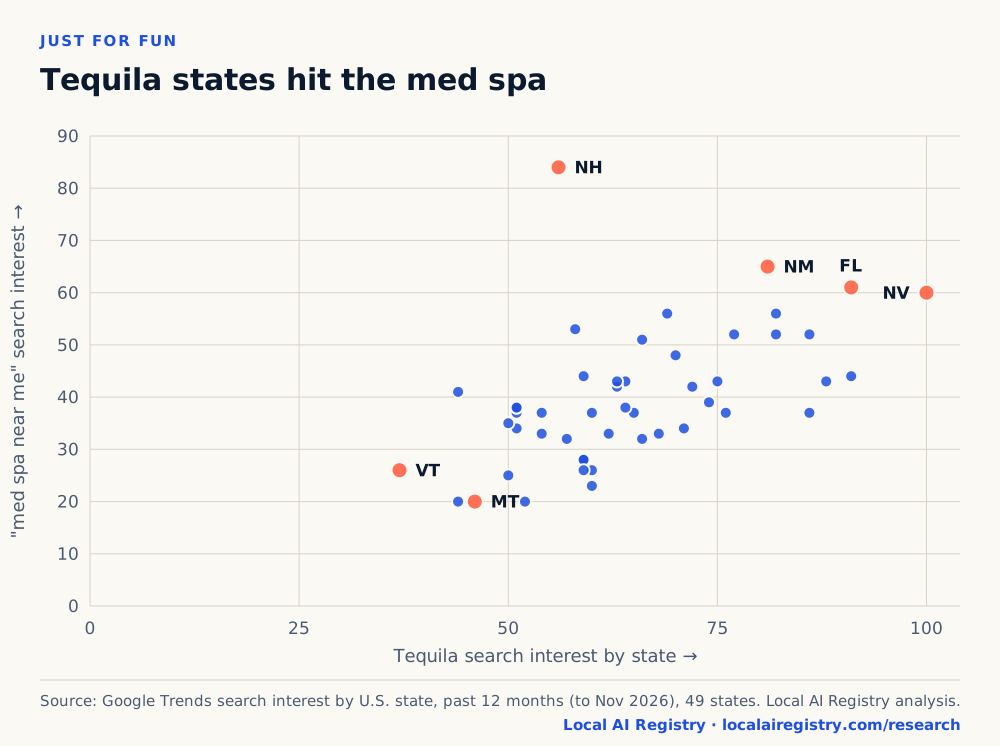
| State | tequila search interest | med spa near me search interest |
|---|---|---|
| NV | 100 | 60 |
| FL | 91 | 61 |
| TX | 91 | 44 |
| CA | 88 | 43 |
| SC | 86 | 37 |
| GA | 86 | 52 |
| AZ | 82 | 56 |
| IL | 82 | 52 |
| NM | 81 | 65 |
| CO | 77 | 52 |
| AR | 76 | 37 |
| OK | 75 | 43 |
| DE | 74 | 39 |
| NC | 72 | 42 |
| MI | 71 | 34 |
| CT | 70 | 48 |
| NJ | 69 | 56 |
| MD | 68 | 33 |
| KS | 66 | 51 |
| NY | 66 | 32 |
| TN | 65 | 37 |
| VA | 64 | 43 |
| IN | 64 | 38 |
| RI | 63 | 42 |
| MO | 63 | 43 |
| LA | 62 | 33 |
| AL | 60 | 26 |
| MS | 60 | 23 |
| WA | 60 | 37 |
| OH | 59 | 44 |
| OR | 59 | 28 |
| NE | 59 | 28 |
| WI | 59 | 26 |
| MA | 58 | 53 |
| MN | 57 | 32 |
| NH | 56 | 84 |
| PA | 54 | 37 |
| SD | 54 | 33 |
| ME | 52 | 20 |
| KY | 51 | 34 |
| ID | 51 | 37 |
| AK | 51 | 38 |
| IA | 51 | 38 |
| HI | 50 | 25 |
| ND | 50 | 35 |
| MT | 46 | 20 |
| WV | 44 | 20 |
| UT | 44 | 41 |
| VT | 37 | 26 |
What will LocalAITrends cover next?
What AI says. The next trends will come from AI answers, not just Google searches.
More people now ask ChatGPT, Google AI Overviews and other assistants which local business to pick. So we are asking them the same local questions across many cities and tracking what comes back: who gets recommended, which sources AI trusts, and how often a business is named at all.
We have started already. In The Local Answer Gap, news outlets supplied 67.5% of the citations in 7,583 Google AI answers about local businesses, while the businesses’ own websites supplied 6.5%. How Often AI Recommends Your Business explains how we measure it. The first AI-answer trend will be posted here when it has been checked.
What do these trends mean for a local business?
The real patterns are a calendar. People search before they book, so be easy to find before the busy day.
Frequently asked questions
What is LocalAITrends?
LocalAITrends is Local AI Registry’s series of short, fun data stories about what people search before they visit a local business. Each trend comes from real search data and is labeled either a real pattern, which repeats year after year, or just for fun, which is a coincidence worth a laugh.
Where does the LocalAITrends data come from?
From Google Trends and Google Ads search volumes for the United States, pulled through DataForSEO in November 2026. The numbers measure search interest, not sales, bookings or visits.
What does a match score mean?
A match score shows how closely two lines move together, from 1.00 (exactly together) through 0 (no link) to −1.00 (exact opposites). Over time, it compares five years of monthly search interest. Across states, it compares how 49 states rank on each search.
Does lip filler cause Pilates?
No. Two searches can rise together because something else drives both, such as summer, wedding season, income or city life. That is why most LocalAITrends cards say “Correlation, not causation.”
Why do Botox searches peak before Thanksgiving?
People want to look rested before family gatherings and holiday photos, and Botox takes several days to show results. In every year from 2021 to 2025, the week before Thanksgiving beat Thanksgiving week by 28% to 50%.
Which search twins held up?
Only nose job and tarot. Of the 14 viral pairs, 13 fell apart once we also checked states and the age mix of searchers. In a wider test of 680 pairs, only nose job with tarot and Botox with wedding dress passed all three tests, as reported in Med Spa Search Signals.
What does this have to do with AI?
AI assistants such as ChatGPT and Google AI Overviews now answer many of these same local questions. The next LocalAITrends entries will come from AI answers themselves: what AI recommends, where and how often. Local AI Registry’s earlier study, The Local Answer Gap, already looked at 7,583 Google AI answers about local businesses.
Can I use these charts?
Yes. The charts and cards are licensed CC BY 4.0. Use them with credit to Local AI Registry and a link to this page. Every chart has an embed code that includes the credit.
Glossary
- Search interest
- Google Trends’ 0 to 100 score for how often a term is searched, where 100 is that term’s busiest week, day or state in the window.
- Match score
- A correlation between two lines, from 1.00 (move exactly together) to −1.00 (move in opposite directions).
- Rank correlation
- A match score that compares how 49 states rank on two searches, so one outlier state cannot drive the result.
- Search twin
- Two unrelated searches whose five-year charts look almost the same.
- Correlation, not causation
- Two things moving together does not mean one causes the other.
- Hidden third factor
- Something else, such as summer or income, that pushes two searches up at the same time and makes them look linked.
- Real pattern
- A LocalAITrends label for a pattern that repeats across years or holds up under further tests.
- AEO (answer engine optimization)
- Work that helps a business get found, described correctly and recommended by AI assistants.
Limits of this research
- Google Trends shows relative interest, not counts. Each line is scaled to its own peak unless a chart says the lines were pulled together.
- Search is not sales. A spike in “liquor store near me” likely means people checking holiday hours, not record sales.
- State comparisons describe states, not people. A Tesla state that searches facelifts does not mean Tesla owners get facelifts.
- We tested many pairs and show the fun ones. Some matches are luck, which is the point of the “just for fun” label.
- The newest days in Google’s data, such as November 13, 2026, can still shift a little. Single-day spikes can be data blips; the dispensary series has one on April 22, 2026.
- All data is for the United States.
References
Data sources
- Google Trends (2021 to 2026), U.S. weekly, daily and state search interest, accessed through DataForSEO, pulled November 14 to 15, 2026.
- Google Ads (2025), U.S. monthly search volumes for December 2025, accessed through DataForSEO.
Related Local AI Registry research
- Local AI Registry Research Team (2026). Med Spa Search Signals: what Google searches reveal about aesthetic clients and sales.
- Local AI Registry Research Team (2026). The Local Answer Gap: what 7,583 Google AI answers reveal about AEO for local businesses.
- Local AI Registry Research Team (2026). How Often AI Recommends Your Business.
Background reading
- Choi, H., and Varian, H. (2012). Predicting the Present with Google Trends. Economic Record, 88(s1), 2–9.
- Rudder, C. (2014). Dataclysm: Who We Are (When We Think No One’s Looking). Crown. By the cofounder of OkCupid, whose OkTrends blog inspired this series.
- Vigen, T. (2015). Spurious Correlations. Hachette Books.
The trends and analysis on this page are Local AI Registry’s, not the original authors’ or Google’s.
How to cite this research
You are welcome to use these trends, charts and cards with credit. They are licensed CC BY 4.0, and every chart above has a ready-made embed code that credits the source.
- “Botox search interest in the week before Thanksgiving beat Thanksgiving week by 28% to 50% in each of the last five years.” Local AI Registry, LocalAITrends (2026)
- “Thanksgiving Day was the top day for ‘liquor store near me’ searches from mid-November to April, at 2.4 times New Year’s Eve.” Local AI Registry, LocalAITrends (2026)
- “Of 14 viral search twins, 13 fell apart when tested on states and age mix. Nose job and tarot held up.” Local AI Registry, LocalAITrends (2026)
Local AI Registry Research Team (2026). LocalAITrends: What America Searches Before It Books. Local AI Registry. https://localairegistry.com/research/local-ai-trends
Data: the tables behind every chart and card are available as a CSV download. Search data comes from Google Trends and Google Ads through DataForSEO. The analysis and findings are Local AI Registry’s.